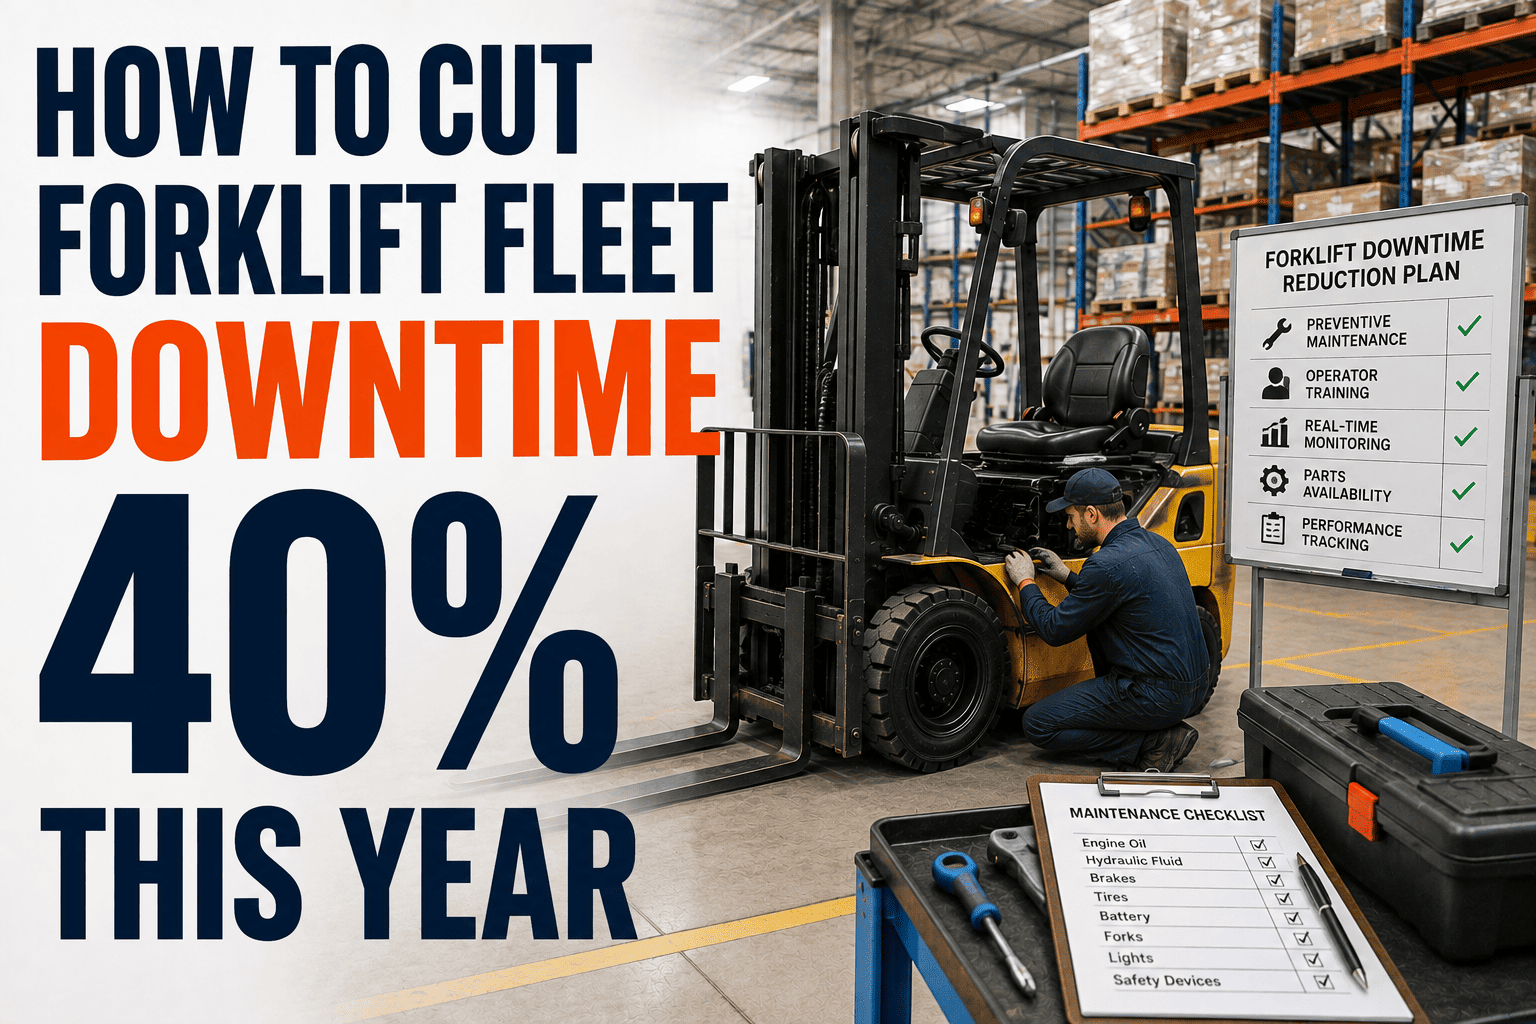
Forty percent sounds like a marketing number until you break down where forklift downtime actually comes from. Most of it is not random bad luck. It is a predictable mix of missed early warning signs, parts sitting on order instead of on a shelf, and repair work orders that take hours to even reach a technician. Fix those three things in sequence over a year, and a 40 percent reduction in downtime is not optimistic, it is closer to the expected outcome plants see once they stop treating maintenance as a reaction and start treating it as a system. Sign up free and FleetRabbit will show you exactly where your fleet's downtime is coming from in the first week.
Cutting forklift fleet downtime by 40 percent in a year comes from stacking four levers rather than pulling one: predictive maintenance that catches developing failures before they happen, a criticality-based spare parts stock that removes wait time from repairs, digital work orders that cut mean time to repair, and strict preventive maintenance compliance tracked by real operating hours. Plants combining these typically see measurable gains within the first 90 days, with the full 40 percent reduction compounding over 9 to 12 months as more fleet data accumulates.
The Four Levers That Actually Move Downtime
Not every downtime fix carries equal weight. Some levers deliver results in the first month. Others compound slowly and become the biggest contributor by the end of the year. Understanding which is which decides where to focus first.
What a Realistic Year Looks Like
Downtime reduction is not a switch you flip once. It builds in stages as your maintenance team shifts from firefighting to a planned rhythm, and each quarter tends to unlock a different lever.
The Levers Compound, They Do Not Add
Predictive maintenance alone catches a large share of potential failures. Of the ones that still slip through, real-time monitoring catches roughly half of those. Layering parts readiness and faster work orders on top of that reduces the remaining downtime even further, which is why the full 40 percent target usually shows up around month nine or ten rather than month one.
Track These Numbers Monthly
Mean time between failures, mean time to repair, PM compliance rate, and parts availability rate are the four numbers that tell you whether the plan is actually working. Reviewing them monthly, rather than assembling them by hand at quarter end, is what keeps a downtime reduction program from quietly stalling.
| Metric | Reactive Fleet Baseline | After a Structured Program |
|---|---|---|
| Mean Time to Repair | 8 to 14 hours including parts wait | 2 to 8 hours with parts and work orders ready |
| Unplanned Breakdowns | Frequent, largely unpredicted | Meaningfully reduced as predictive alerts intervene early |
| PM Compliance | Tracked loosely on paper or spreadsheet | Tracked by real hour meter with automatic escalation |
| Parts Wait Time | Days for non-stocked critical parts | Near zero for parts stocked by failure history |
FleetRabbit combines predictive alerts, parts tracking, and digital work orders in one place, so your team can see exactly which lever will move the needle fastest for your fleet. Sign up free and get your baseline in the first week.
Where Plants Get Stuck Along the Way
A downtime reduction plan rarely fails because the strategy was wrong. It stalls because one of the four levers gets skipped, usually the one that feels least urgent in the moment.
Treating Predictive Data as Optional
Some plants adopt sensors and alerts, then keep responding to them the same way they responded to a breakdown, after the fact. The value only shows up when a flagged alert triggers a scheduled repair before the truck fails, not after.
Stocking Parts by Guesswork Instead of History
A shelf full of parts that rarely fail does nothing for your mean time to repair. Stocking decisions need to follow actual failure history and lead time on your specific fleet, not a generic list from a manufacturer catalog.
Starting the Year With a Clear Baseline
Every downtime reduction program that reaches its target starts the same way, by measuring where the fleet actually stands before changing anything. Book a demo and FleetRabbit's team will walk through your current MTTR, PM compliance, and breakdown pattern, then map out which lever will move your fleet's downtime fastest.
FleetRabbit combines predictive alerts, parts readiness tracking, and digital work orders in one platform, giving your team the exact levers that compound into a measurably more reliable fleet within a year.







