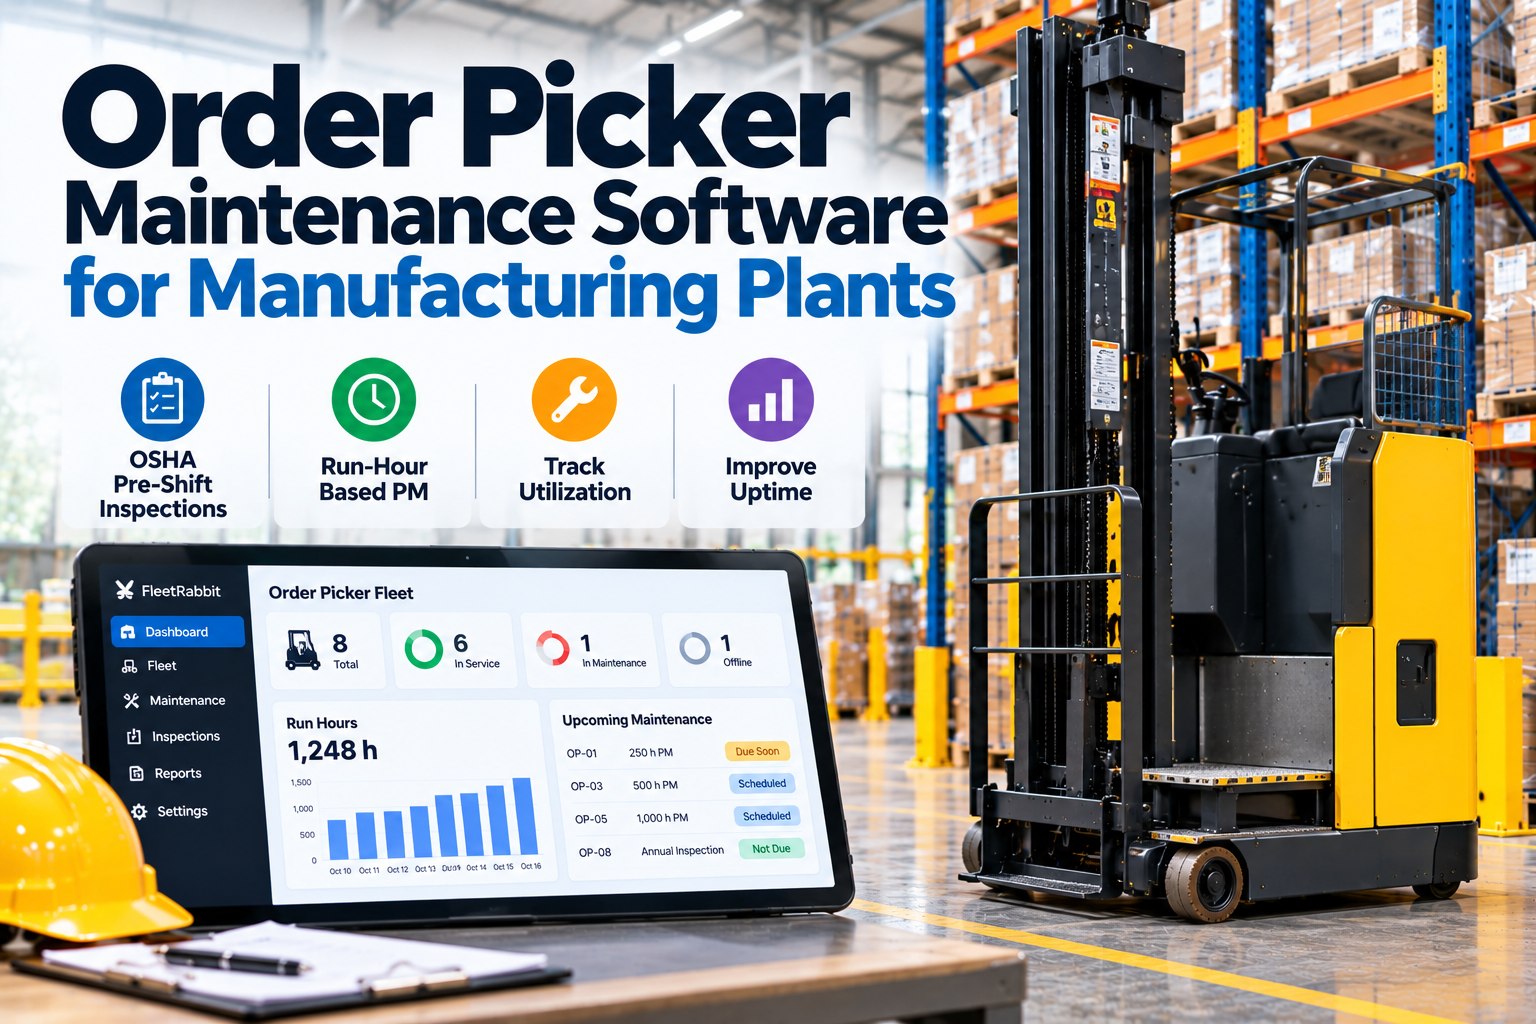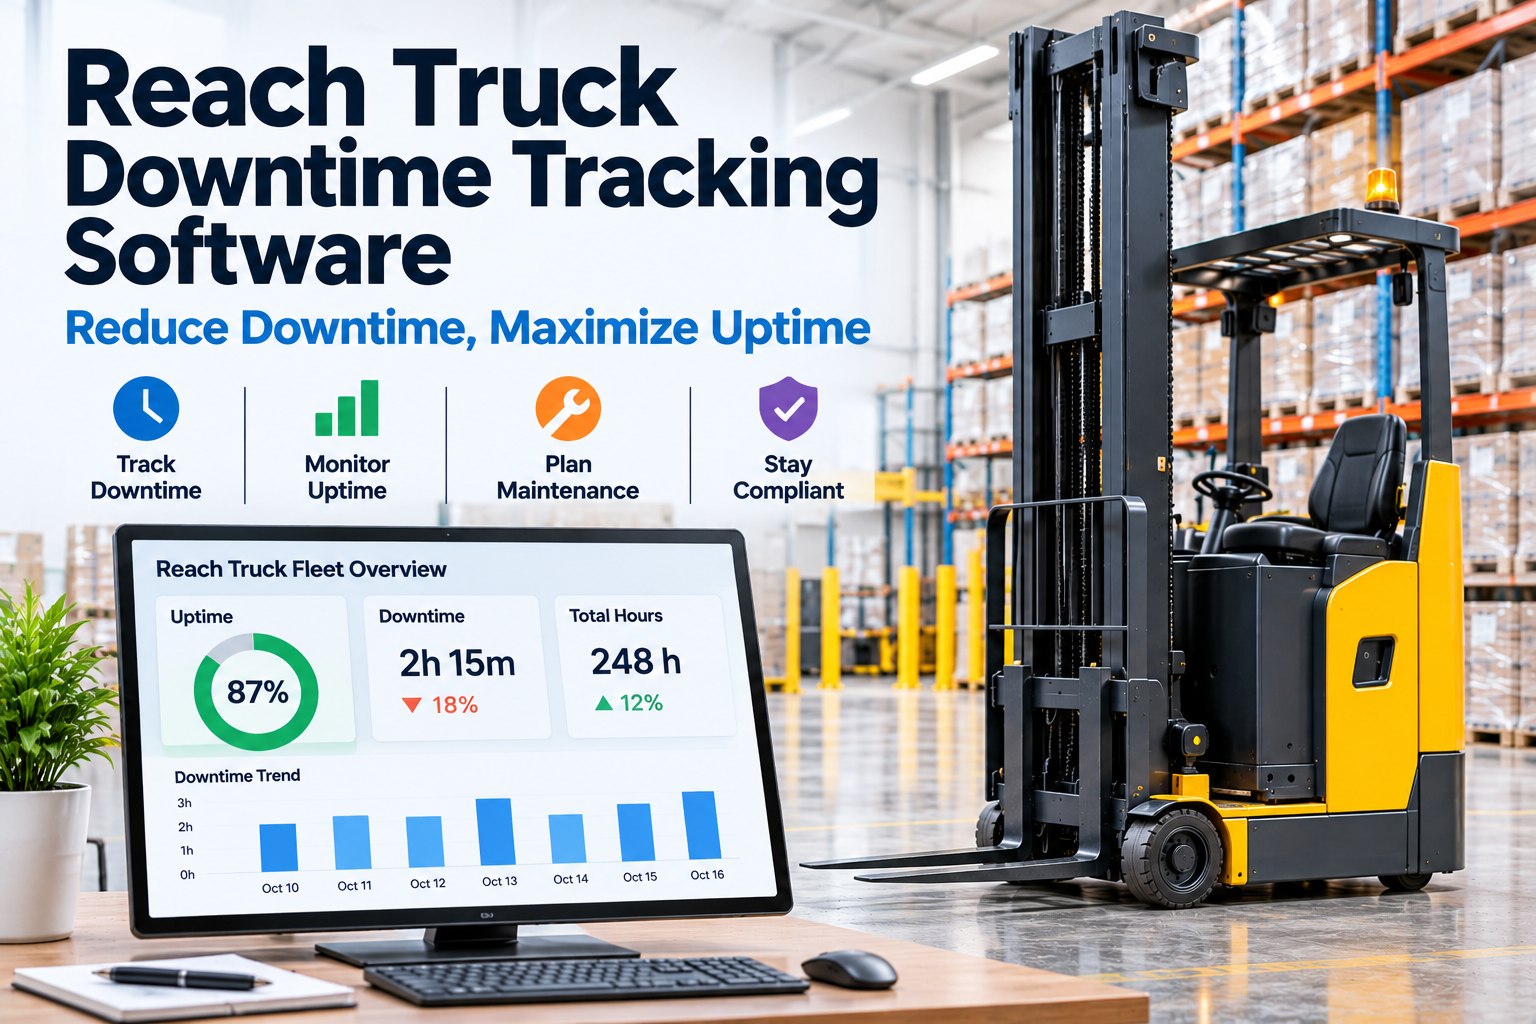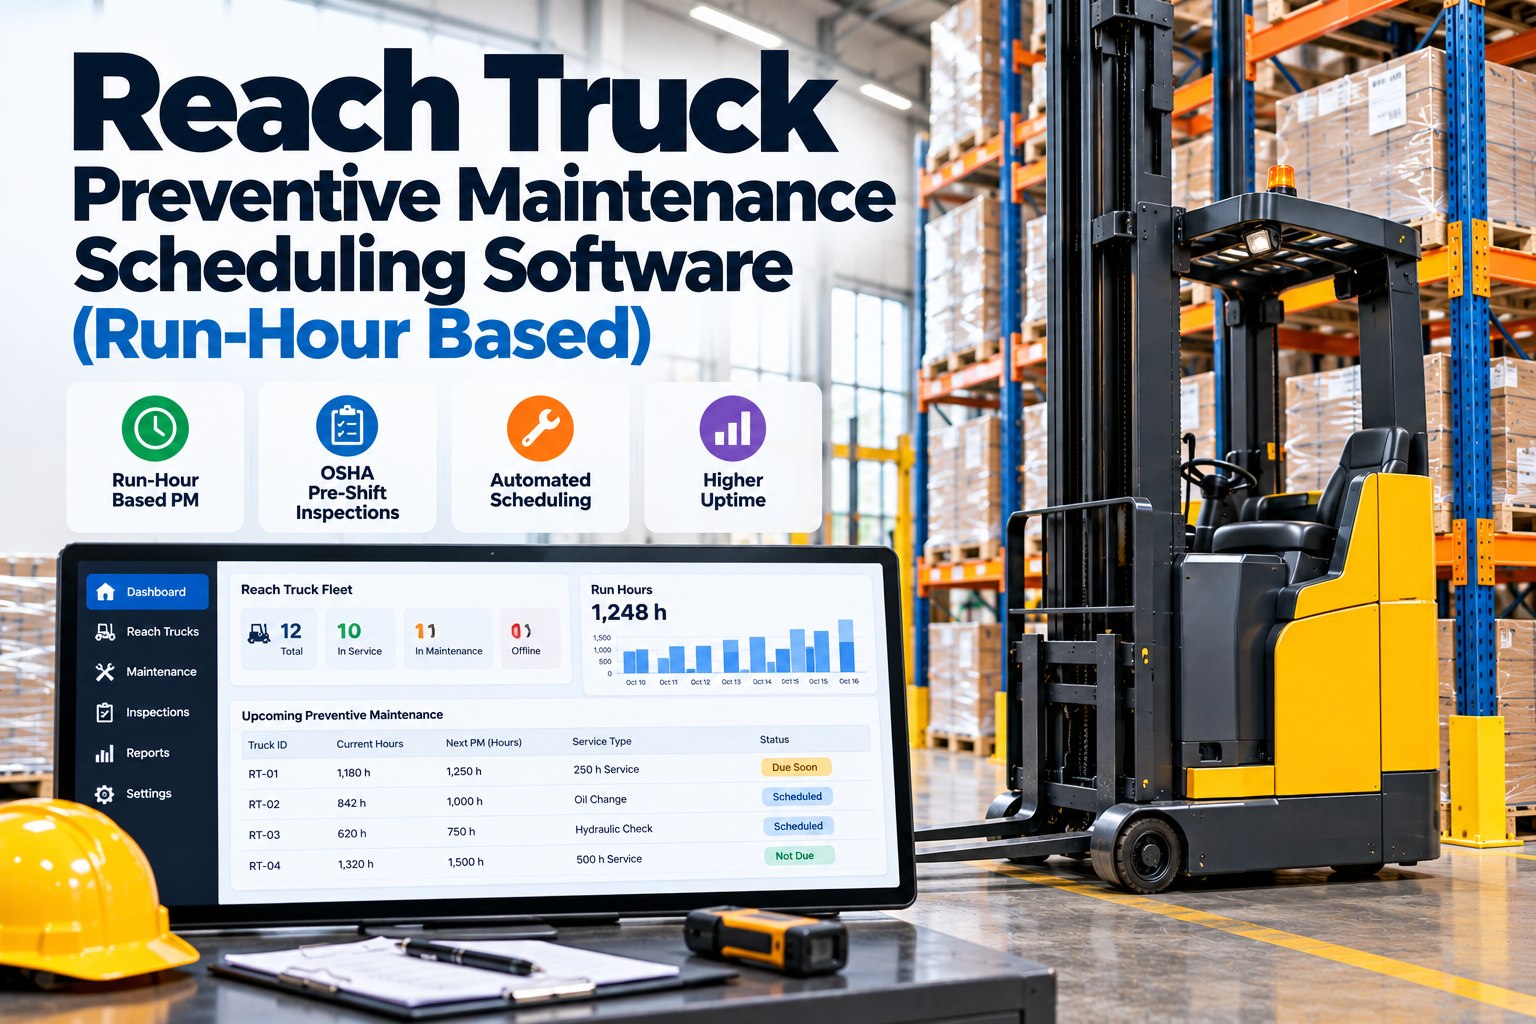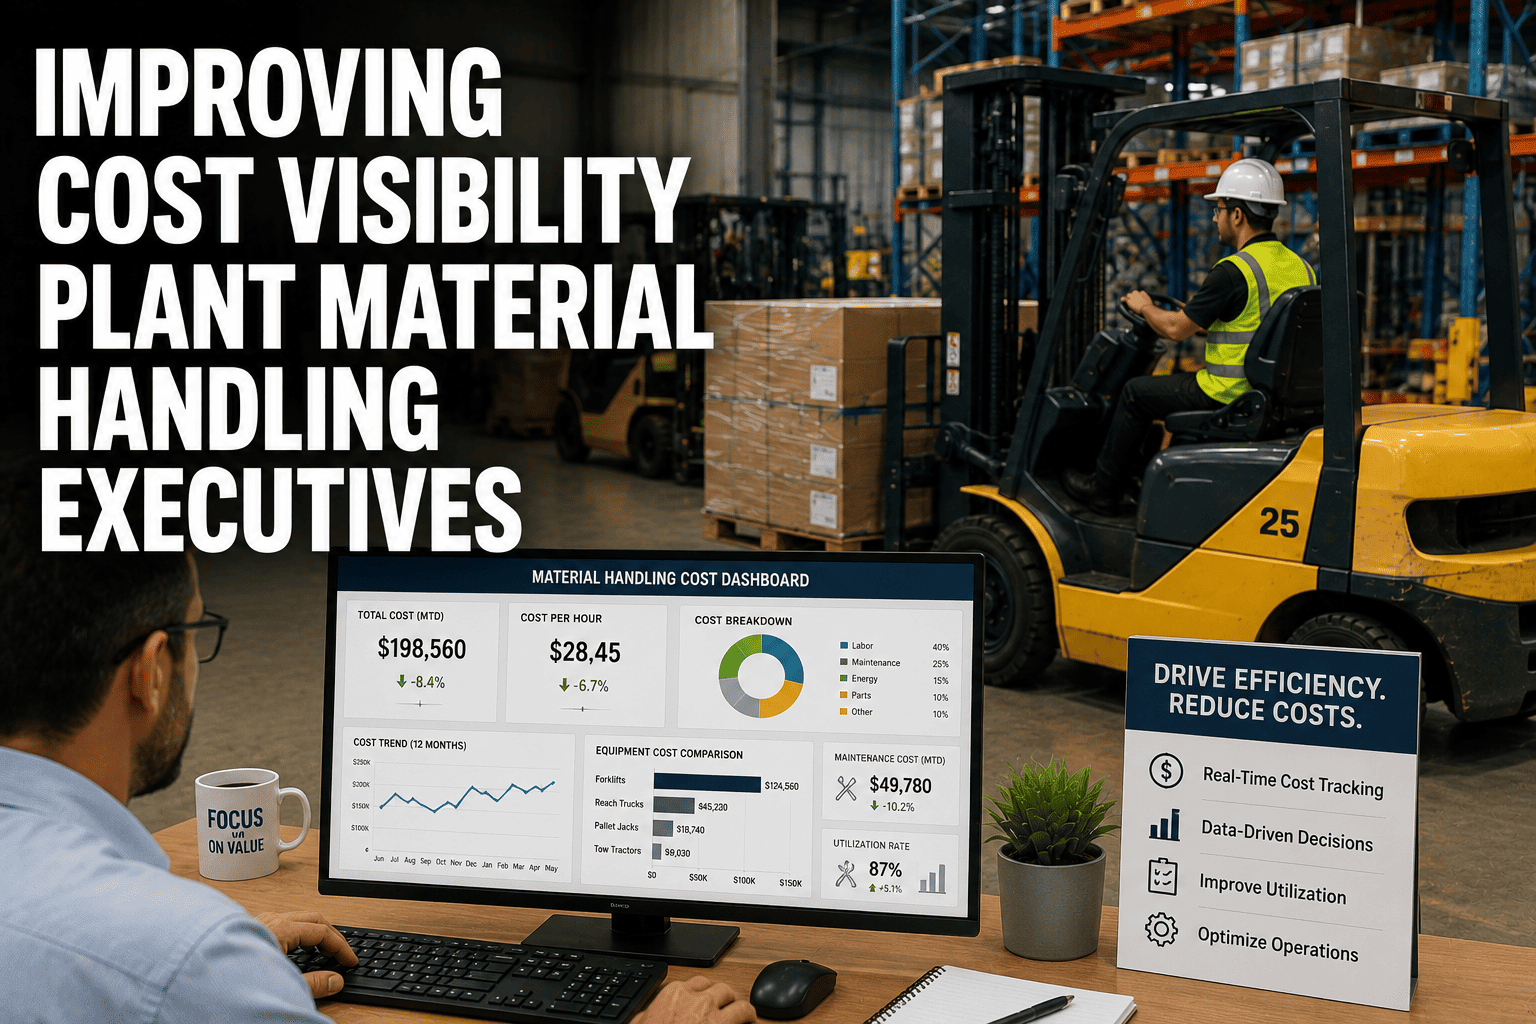
In a manufacturing plant, material handling is often treated as a single, massive expense. Executives see the total fleet cost on the P&L, but they cannot break it down by department, zone, or asset. Improving cost visibility for plant material handling executives is essential for making informed decisions about automation, right-sizing, and outsourcing. FleetRabbit rolls operational data into executive cost views that drive plant decisions. You can sign up for FleetRabbit to modernize your financial tracking, or book a demo to see our platform.
Over 60 percent of manufacturing executives lack granular visibility into their material handling costs. They see a massive lump-sum expense, but cannot break down cost-per-hour or cost-per-department. Implementing executive cost dashboards reduces material handling spend by 15 to 20 percent, allowing plants to identify inefficient zones and right-size their fleets.
The True Cost of Poor Executive Visibility
The true cost of poor executive visibility extends far beyond the immediate material handling budget. When a manufacturing plant cannot accurately track forklift costs, the financial damage ripples across the entire operation. The immediate loss of capital is obvious, but secondary costs often exceed the primary impact. Executives are forced to make strategic decisions based on guesses rather than data. They approve automation projects for zones that are actually efficient, while ignoring zones that are bleeding cash. Furthermore, they cannot hold department managers accountable for their share of the material handling budget, leading to a culture of unchecked spending.
Why Forklift Costs Are a Black Box
Forklift costs are a black box because operational data and financial data live in separate silos. The maintenance team tracks labor and parts on one spreadsheet, the fuel vendor sends an invoice to accounting, and the operations team tracks hours on a whiteboard. No one rolls these distinct data points into a single, executive-level view. When the CFO asks, "What is the cost per hour of the shipping department's forklifts?" no one can answer. This lack of integration ensures that material handling remains an unmanageable, aggregated expense.
The Danger of Aggregated Data
The danger of aggregated data is that it hides outliers. If a plant has 50 forklifts and the total maintenance budget is 500,000 dollars, the executive assumes the cost is 10,000 dollars per truck. However, 5 of those trucks might be costing 40,000 dollars each in emergency repairs, while 10 are costing almost nothing. Aggregated data hides the 5 expensive outliers, preventing the executive from replacing them. This ensures the plant will continue to bleed cash on lemons. To fix this, you can sign up for FleetRabbit to modernize your financial tracking, or book a demo to see our platform.
FleetRabbit rolls operational data into executive cost views, showing cost per hour, per zone, and per department. Stop guessing at your material handling ROI and start making data-driven decisions. Start your free trial today to gain total visibility.
Strategies for Granular Cost Tracking
Granular cost tracking requires a fundamental shift from aggregated accounting to operational finance. The first strategy is calculating true cost per hour. A system must track total spend on a truck and divide it by actual run hours. The second strategy is zone tracking. Costs must be allocated to the specific aisles or departments where the trucks operate. The third strategy is departmental cost allocation, ensuring that the shipping department's budget pays for the shipping department's forklifts. By executing these strategies, executives gain the granular visibility needed to drive real plant decisions.
| Cost Metric | Executive Question | Visibility Flaw | FleetRabbit Solution |
|---|---|---|---|
| Cost Per Hour | Are we hitting our 4 dollar per hour target | Aggregated fleet averages hide lemons | Per-asset true cost per hour tracking |
| Cost Per Zone | Is Zone A more efficient than Zone B | No way to separate expenses by aisle | Geofenced zone cost allocation |
| Department Allocation | Who is responsible for this spend | Single plant budget hides accountability | Costs billed to specific departments |
| Utilization Rate | Do we need to buy more forklifts | No data on idle vs active time | Real-time engine hour utilization tracking |
| Maintenance ROI | Should we replace or repair this truck | Lifetime repair cost not tracked | Lifetime cost per asset dashboards |
Rolling Operational Data into Executive Views
Rolling operational data into executive views is the most critical step in breaking the black box. A failure history database connects every work order, fuel receipt, and hour of operation to a specific forklift. FleetRabbit's system automatically aggregates this data and presents it in a financial format. Instead of seeing "50 work orders," the executive sees a chart showing "cost per hour by asset." This connection ensures the CFO has the exact financial metrics needed to make strategic capital decisions.
Calculating Cost Per Hour and Per Zone
Calculating cost per hour and per zone requires integrating telematics with accounting. FleetRabbit tracks true engine hours and divides the total asset cost by that number. If a truck costs 15,000 dollars to run for 3,000 hours, the executive sees a 5 dollar cost per hour. Furthermore, by using geofencing, the system allocates those hours to specific zones. The executive can see that Zone A's trucks cost 6 dollars per hour, while Zone B's cost 4 dollars. This allows the plant to investigate Zone A's inefficiencies immediately.
Departmental Cost Allocation
Departmental cost allocation ensures accountability. When the shipping department requests a new forklift, the executive can pull up their current cost allocation. If the shipping department's trucks are costing 8 dollars per hour, double the plant average, the executive can deny the new purchase and demand an investigation into their maintenance practices. This forces department managers to treat material handling as their own budget. To enforce this, you can sign up for FleetRabbit to modernize your financial tracking, or book a demo to see our platform.
How FleetRabbit Drives Plant Decisions
FleetRabbit is engineered to connect the plant floor directly to the executive boardroom. Our platform combines telematics, work order management, and financial tracking into a single dashboard. We understand that executives do not want to see individual work orders; they want to see cost per hour and utilization trends. Our system rolls the operational data up into these exact executive views, ensuring the CFO has the intelligence needed to make strategic decisions about automation, outsourcing, and capital expenditures.
Real-Time Executive Dashboards
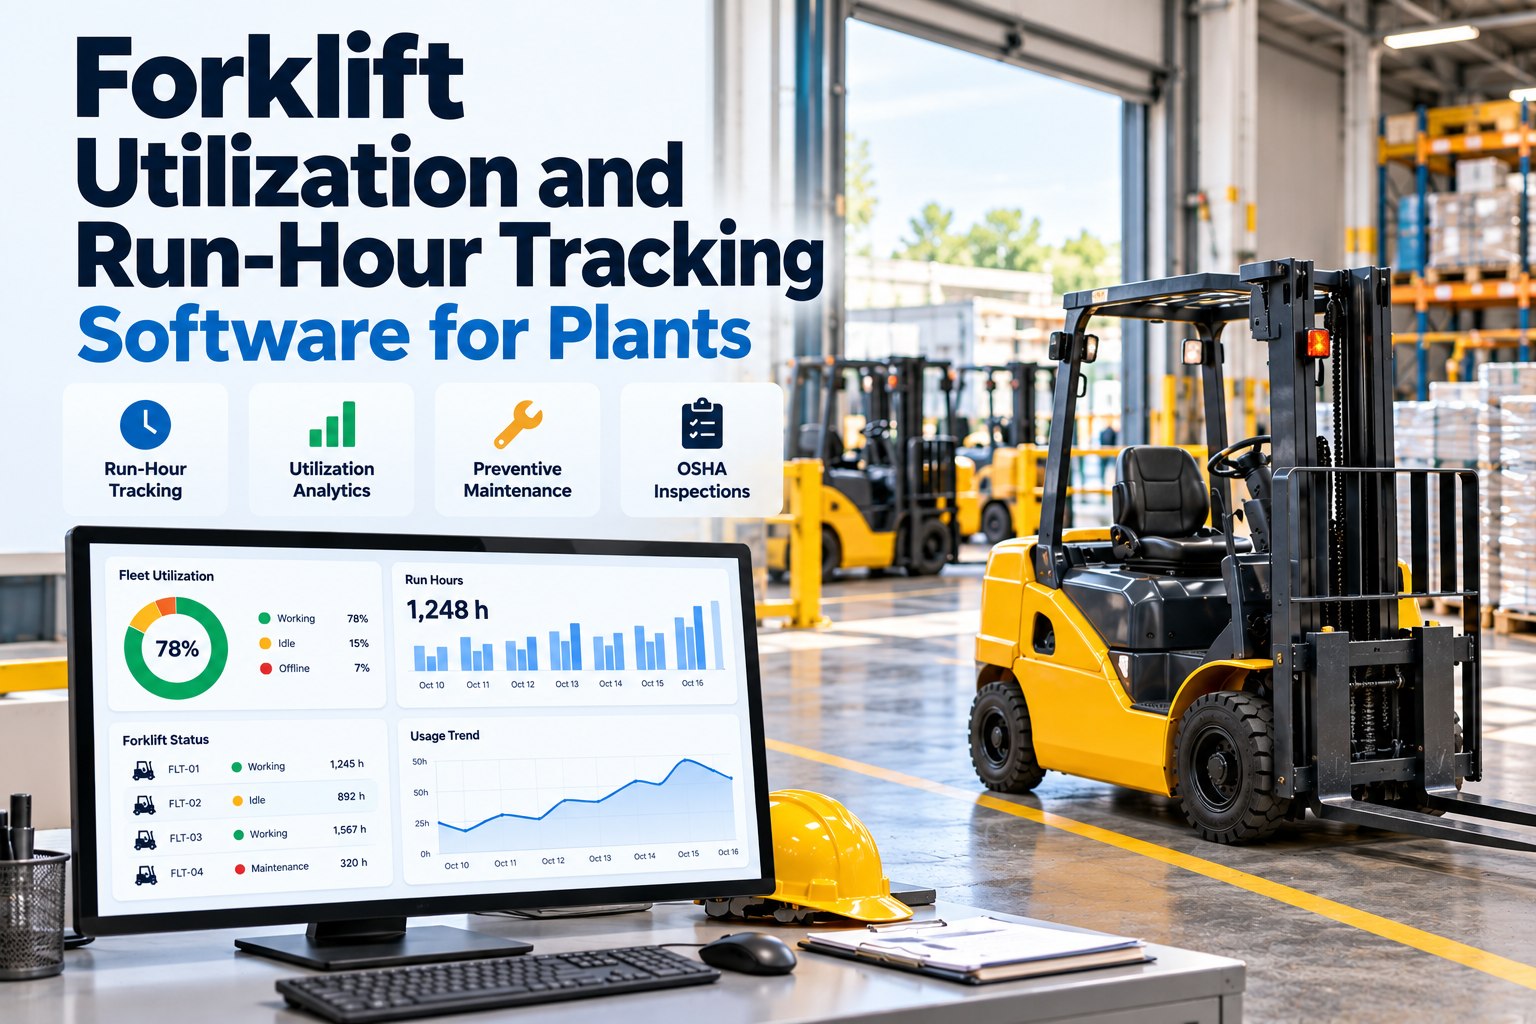
Real-time executive dashboards mean the CFO no longer has to wait for end-of-month reports. The FleetRabbit dashboard provides a live view of material handling costs. If a specific zone spikes in cost per hour due to a breakdown, the executive sees it immediately. This allows for rapid intervention and corrective action. The dashboard also tracks utilization, showing the executive exactly what percentage of their 50-truck fleet is actually moving, preventing unnecessary new purchases.
Identifying Outsourcing Opportunities
Identifying outsourcing opportunities is a key benefit of granular cost visibility. If an executive sees that their internal material handling cost per hour is 12 dollars, but a third-party logistics provider offers to do it for 9 dollars, they can make an informed decision. Without this data, the executive cannot evaluate the bid. Furthermore, if the data shows that 5 specific trucks are costing 20 dollars per hour, the executive can identify a capital expenditure need to replace those lemons. This data-driven approach prevents bad investments and protects the bottom line.
Key Takeaways for Plant Executives
Improving cost visibility for plant material handling executives is the most critical step in optimizing a manufacturing budget. Relying on aggregated accounting and disconnected silos is a guaranteed way to overspend and hide inefficiencies. A granular, data-driven approach to cost tracking ensures every department is accountable and every asset is measured. Plants that fix this process see a massive reduction in material handling spend and a huge boost in capital efficiency.
Implementing a comprehensive platform like FleetRabbit tracks cost per hour, allocates costs by zone, and provides real-time executive dashboards. The return on investment is immediate, not just in saved expenses, but in eliminated bad investments, improved accountability, and extended asset lifecycles. Manufacturing plants demand financial control, and FleetRabbit provides the exact digital tools needed to deliver it.
The path forward is clear. Evaluate your current material handling budget and ask if you can break down the cost per hour by department. If you are relying on aggregated data, you are losing money. Plant executives who address cost visibility systematically protect their profitability and operational reliability. You can sign up for FleetRabbit to modernize your financial tracking, or book a demo to our platform.
Frequently Asked Questions About Cost Visibility
Every day you rely on aggregated data is a day you overspend on inefficient trucks and bad investments. FleetRabbit tracks cost per hour and allocates expenses by zone, giving executives total control. See a 20 percent reduction in spend within weeks. Start your free trial today with no credit card required.