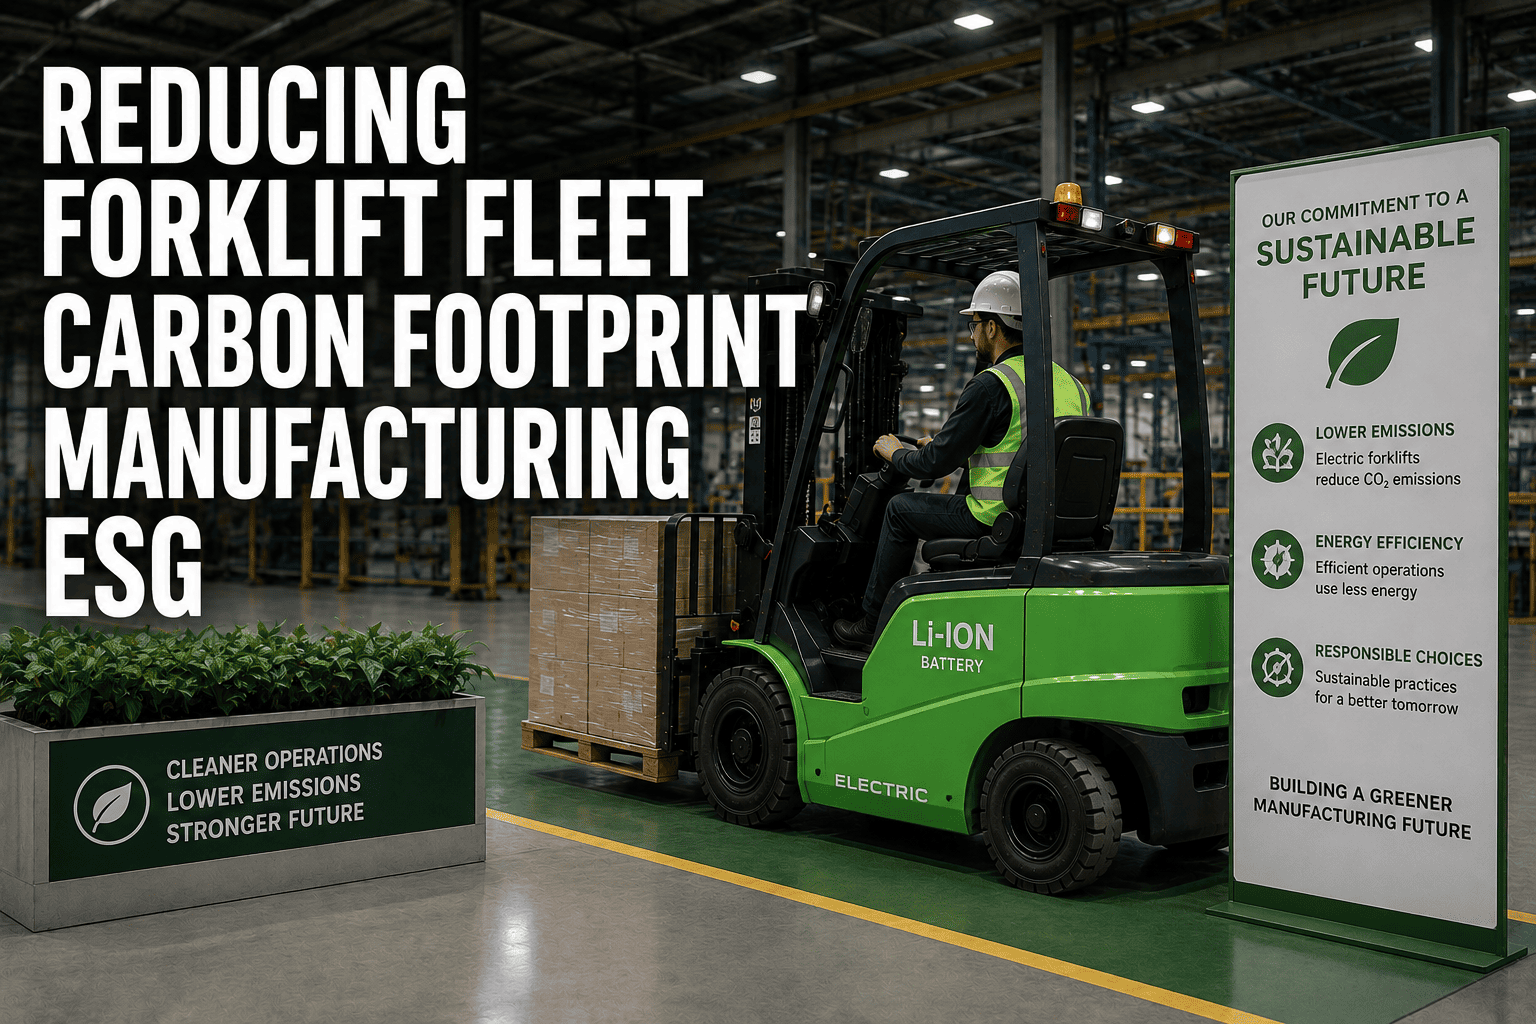
Somewhere in your plant's ESG report, a line item is quietly growing: material handling emissions. It rarely gets the attention that furnaces, boilers, or company vehicles do, yet a fleet of diesel or propane forklifts running two or three shifts a day adds up fast, and it counts directly toward your Scope 1 footprint. As investors, customers, and regulators ask harder questions about where emissions actually come from, the forklift fleet has moved from an operational afterthought to a line item that shows up in board-level sustainability conversations.
Diesel and propane forklifts fall under Scope 1, direct emissions from equipment your plant owns and operates. Electric forklifts eliminate that tailpipe output, but the electricity used to charge them still counts as Scope 2, and because forklifts often run up to 20 hours a day across multiple shifts, that electricity share can account for over 90 percent of an electric forklift's total lifecycle footprint. Facilities emitting at least 25,000 metric tons of CO2 annually must already report Scope 1 data to the EPA.
Where Forklifts Actually Sit in Your Emissions Picture
Carbon accounting splits emissions into three scopes, and a forklift fleet touches two of them directly. Understanding which scope each fuel type falls into is the first step to reporting accurately and knowing where reduction effort actually pays off.
Why This Is Landing on the Boardroom Agenda Now
Manufacturers are no longer the only ones asking about forklift emissions. What sits on your Scope 1 ledger often becomes your customer's Scope 3 disclosure, which means a customer under pressure to report their supply chain footprint will eventually ask you for your numbers too. California's Climate Corporate Data Accountability Act extends reporting obligations to a much wider set of companies than the federal 25,000-ton threshold, and investor-driven frameworks like the Science Based Targets initiative are pushing fleets toward a common benchmark: a 42 percent reduction in Scope 1 emissions by 2030 against a verified baseline year.
None of that pressure works without accurate data first. A target set without a real baseline can't be measured, can't prove ROI to a finance team, and can't survive scrutiny from an auditor or a customer's procurement office. Before electrification budgets get approved, most sustainability teams need a defensible answer to a simple question: how much carbon does the current forklift fleet actually produce, broken down by truck, shift, and fuel type.
FleetRabbit tracks fuel consumption, idle time, and charging data across every truck automatically. Sign up free and see your fleet's current carbon output this week.
Diesel vs Electric: The Comparison That Actually Matters
The gap between an internal combustion forklift and an electric one is large enough to reshape a fleet's entire emissions profile, but the comparison is more nuanced than "electric equals zero." Here is how the two stack up across a typical duty cycle.
Why Electric Isn't Automatically a Zero on Your Report
Electric forklifts produce zero tailpipe emissions, which eliminates their Scope 1 footprint entirely. But because forklifts often run two or three shifts a day, far more intensively than a typical passenger EV, the electricity needed to keep them charged becomes the dominant factor in their total lifecycle emissions. In facilities served by a carbon-heavy grid, that Scope 2 share can exceed 90 percent of the truck's footprint, which is why the source of your electricity matters just as much as the decision to electrify.
What Actually Moves the Needle Once You've Electrified
Procuring renewable electricity contracts, scheduling charging during lower-carbon grid hours, and reducing idle charging time all lower the Scope 2 share that remains after Scope 1 is eliminated. Tracking charging patterns by truck and shift is the only way to know which of these levers is worth pulling first.
Building a Fleet Carbon Reduction Roadmap
A credible reduction plan follows a specific order, and skipping a step tends to produce numbers that don't hold up under review.
| Step | What It Involves | Why It Comes at This Point |
|---|---|---|
| Establish a Baseline | Measure current fuel use, engine hours, and charging data across every truck in the fleet. | Without a verified starting point, any reduction claim is unmeasurable and unverifiable. |
| Segment by Fuel Type | Separate diesel, propane, and electric trucks to see which segment drives the largest share of emissions. | Reveals where electrification will deliver the fastest Scope 1 reduction. |
| Prioritize High-Utilization Trucks | Target the forklifts running the most hours per week for electrification first. | These trucks produce the largest emissions reduction per unit converted. |
| Optimize Charging Behavior | Shift charging schedules and reduce idle draw once electrification begins. | Controls the Scope 2 share that remains after tailpipe emissions disappear. |
| Report Against the Baseline | Track progress quarterly and compare against the original verified numbers. | Turns the reduction into a defensible figure for investors, customers, and regulators. |
The Regulatory Landscape Is Moving Faster Than Most Fleets Are
Federal reporting has applied to large emitters since 2009, but state-level rules are broadening the scope of who needs to disclose. California's climate disclosure law extends reporting obligations well beyond the traditional large-emitter threshold, and customer procurement teams are increasingly asking mid-sized suppliers for emissions data even when no law requires it yet. Waiting until a mandate forces the issue tends to mean scrambling for data that should have already been collected.
FleetRabbit ranks your trucks by engine hours and emissions impact, so electrification budget goes to the fleet that will move your baseline the most. Book a demo to see your fleet's priority list.
Key Takeaways
Forklift fleets sit at the intersection of two emissions scopes that manufacturers can no longer treat as background noise. Diesel and propane trucks are a direct, easily reducible Scope 1 source, while electric trucks shift the challenge to Scope 2, where the electricity source and charging behavior determine how much benefit electrification actually delivers. Neither number means much without a verified baseline behind it.
The manufacturers making real progress aren't the ones with the most ambitious pledge. They're the ones who measured their fleet's actual emissions first, prioritized electrification where utilization was highest, and kept tracking the numbers after the trucks were swapped out. That discipline is what turns an ESG target from a slide in a sustainability report into a number that holds up when a customer, investor, or regulator asks to see it.
FleetRabbit gives manufacturing fleets a live view of fuel use, engine hours, and charging data, turning forklift emissions into a number you can track, reduce, and report with confidence.







