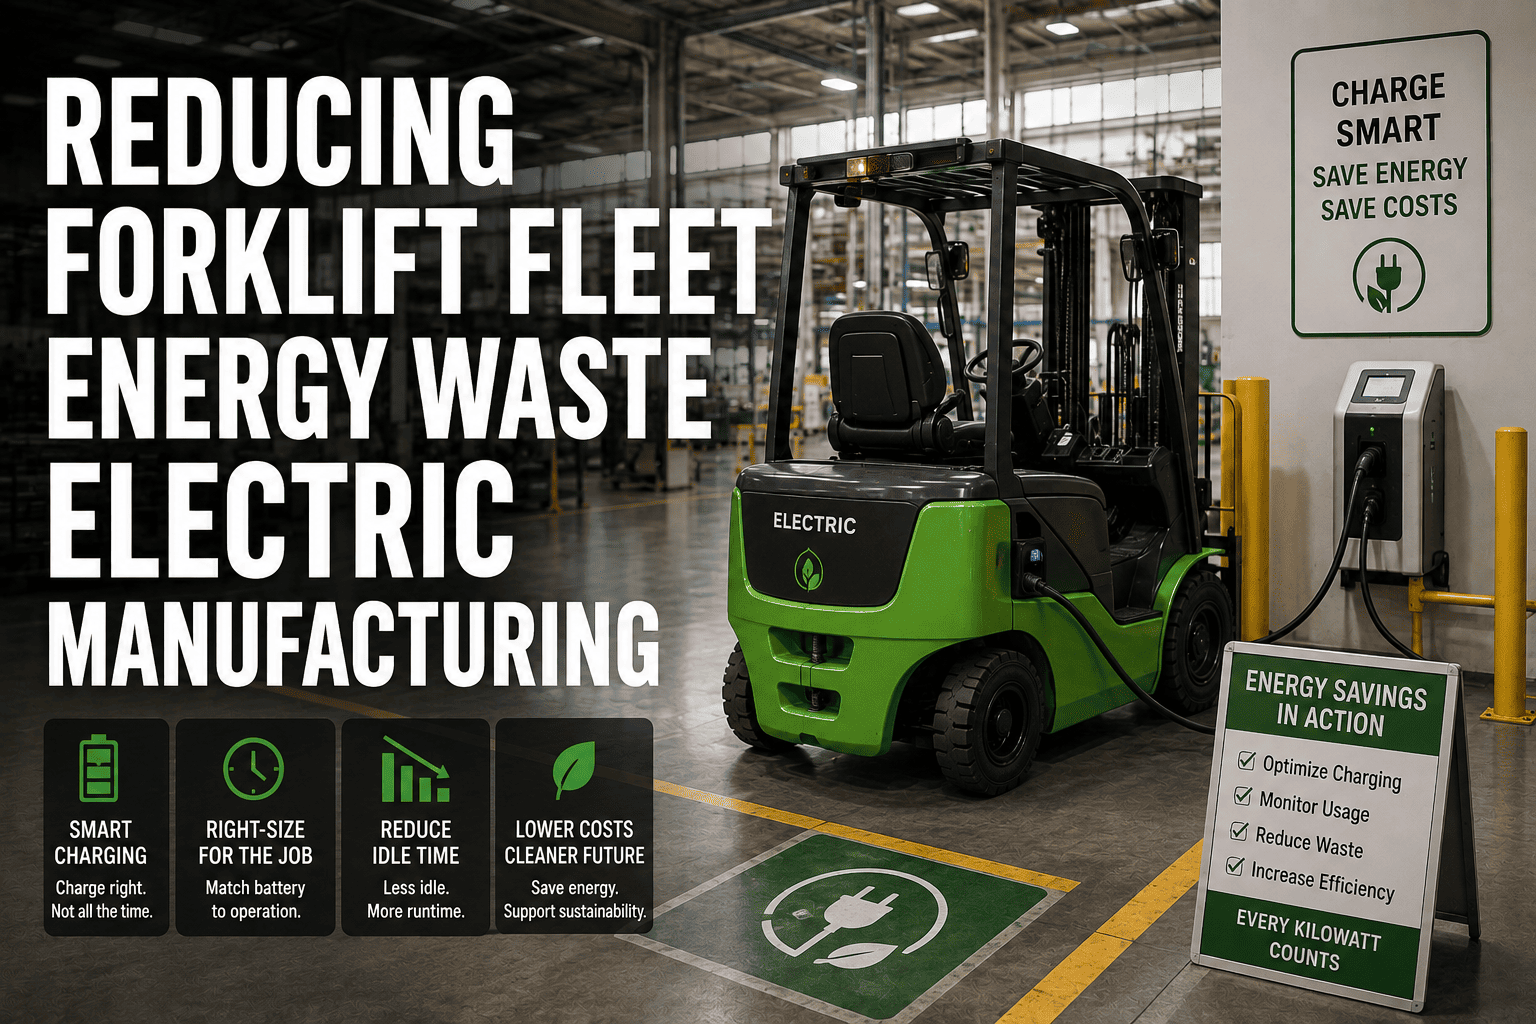
Electric forklift fleets in manufacturing plants are quietly burning through energy budgets in ways that plant managers cannot see and cannot fix without the right data. While electric forklifts eliminate direct fuel costs, they introduce a different kind of energy waste that hides inside charging patterns, idle consumption, battery degradation cycles, and opportunity charging habits. A typical mid-size manufacturing plant operating 30 electric forklifts across two shifts spends 180000 to 320000 dollars annually on electricity for charging alone. Industry analysis shows that 18 to 30 percent of that energy spend is pure waste driven by overcharging, uncoordinated charging schedules, excessive idle draw, and batteries operating far outside their optimal state-of-charge windows. That is 32000 to 96000 dollars per year thrown away on a cost category that most plants do not even track separately from their overall facility electricity bill.
Manufacturing plants waste 18 to 30 percent of electric forklift charging energy through poor charging discipline, uncoordinated schedules, and idle power draw. A 30-forklift electric fleet spending 250000 dollars annually on charging energy throws away 45000 to 75000 dollars in avoidable waste. FleetRabbit identifies exactly where energy waste occurs by tracking charge cycles, idle patterns, and battery state-of-charge data in real time.
Where Electric Forklift Energy Actually Goes
Understanding energy waste requires knowing how electric forklifts consume energy across different operating modes. The total energy consumed by an electric forklift divides into productive travel and lifting, idle standby power, and charging losses. Productive work including driving and lifting typically accounts for 55 to 65 percent of total energy consumed. Idle standby power where the forklift is powered on but stationary accounts for 12 to 18 percent. Charging system losses including heat generation and conversion inefficiency account for 15 to 22 percent. The remaining 5 to 10 percent represents the waste that is truly avoidable through better management practices, primarily overcharging, uncoordinated peak charging, and unnecessary idle hours.
The challenge is that these categories blur together on a standard electricity bill. The plant receives a single monthly charge for total facility power consumption with no breakdown of how much went to forklift charging versus lighting versus production equipment. Without sub-metering or fleet-level energy tracking, the forklift energy waste remains buried inside an aggregate number that nobody analyzes for forklift-specific efficiency. This is the fundamental visibility problem that prevents most plants from taking action. They cannot reduce what they cannot see, and they cannot see forklift energy waste without fleet-level monitoring. Sign up for FleetRabbit to get fleet-level energy visibility that separates forklift charging costs from your overall utility bill.
The Three Biggest Sources of Charging Energy Waste
Uncoordinated Charging That Creates Peak Demand Spikes
When multiple forklifts plug in simultaneously at shift end, the combined charging load creates a sharp demand spike on the plant's electrical system. Utility companies charge for peak demand measured in kilowatts, and these spikes can increase the demand charge component of the electricity bill by 15 to 25 percent even if total kilowatt-hour consumption stays the same. A plant with 30 electric forklifts that all begin charging within a 30-minute window at shift end might see a charging demand spike of 150 to 250 kilowatts. Staggering those same charges across a 4-hour window reduces peak demand to 40 to 80 kilowatts while delivering the same total energy to the batteries. The savings come entirely from reducing the demand charge, not from reducing actual energy consumed, making this one of the easiest waste categories to eliminate because it requires no change in total charging time, only in when charging occurs.
Overcharging Beyond Full State-of-Charge
Lead-acid forklift batteries reach full charge after a specific number of amp-hours are delivered, but many charging systems continue delivering current even after the battery is full. This excess current converts entirely to heat and gassing rather than stored energy, representing pure waste. Equalization charges that are necessary for battery health should occur on a scheduled weekly basis rather than automatically after every charge cycle. Many plants run equalization mode on every charge because the charger settings were never configured correctly during installation, wasting 8 to 12 percent of charging energy on unnecessary equalization cycles. Lithium-ion forklift batteries avoid this particular waste because their battery management systems automatically terminate charging at the correct point, which is one reason lithium systems achieve 15 to 25 percent better charging efficiency than lead-acid in real-world plant operations.
How to Detect Overcharging Without Sub-Meters
FleetRabbit tracks charge cycle duration and energy delivered per cycle by monitoring charger run times and correlating them with battery capacity specifications. If a 48-volt 1000-amp-hour battery consistently shows charge cycles of 10 to 12 hours when the required input should be 8 to 9 hours, the excess hour or two represents overcharging waste. This detection method works without installing individual sub-meters on each charger, reducing implementation cost while still identifying the specific chargers and batteries where overcharging occurs. Once identified, charger settings can be adjusted or replaced, and the savings are verified through subsequent charge cycle data.
Opportunity Charging Misuse on Lead-Acid Batteries
Opportunity charging means plugging in a forklift during brief breaks, lunch periods, or between tasks to top up the battery rather than waiting for a full discharge and recharge cycle. This practice works excellently with lithium-ion batteries that tolerate partial charge cycles without degradation. However, applying opportunity charging to lead-acid batteries significantly reduces battery life and increases total energy consumption. Each partial charge cycle on a lead-acid battery causes uneven plate sulfation that reduces effective capacity over time. A lead-acid battery that receives regular opportunity charging might last 2 to 3 years instead of the expected 5 to 7 years, driving up replacement costs by 60 to 150 percent. The energy waste comes from charging batteries more frequently to deliver the same total work because each partial charge stores less usable energy per cycle due to sulfation effects. Plants that mix opportunity and traditional charging practices across lead-acid fleets often cannot identify which batteries are being damaged until premature failure occurs. Book a demo to see how FleetRabbit tracks charge patterns and flags opportunity charging misuse before it destroys battery life.
FleetRabbit monitors charge cycles, idle power draw, battery state-of-charge patterns, and charging coordination across your entire electric forklift fleet. Get actionable recommendations to stagger charges, eliminate overcharging, and reduce idle waste. Start cutting energy costs within the first week.
Idle Power: The Silent Energy Drain Nobody Watches
When an electric forklift sits powered on but not moving, it still consumes electricity. The hydraulic pump maintains system pressure, the controller board stays active, lights and displays remain on, and the battery management system continues monitoring cell voltages. This idle draw ranges from 200 to 600 watts depending on forklift model, age, and configuration. While 400 watts sounds small, the cumulative impact across a fleet and across thousands of idle hours becomes substantial. A single forklift idling 4 hours per shift across two shifts daily consumes 3200 watt-hours or 3.2 kilowatt-hours per day just sitting still. Across 30 forklifts, that is 96 kilowatt-hours daily or 35040 kilowatt-hours annually of completely non-productive energy consumption. At an industrial electricity rate of 0.08 to 0.12 dollars per kilowatt-hour, idle waste alone costs 2800 to 4200 dollars annually per forklift or 84000 to 126000 dollars for a 30-fleet operation.
Why Operators Leave Forklifts Powered On
Operators leave forklifts powered on during breaks, shift gaps, and extended idle periods for several reasons. Some believe that power-cycling the forklift damages electrical components, a misconception that persists from older forklift generations. Some want to avoid the 10 to 15 second power-up sequence when they return. Some work in environments where restarting during a busy period feels disruptive to workflow. And some simply have never been told that idle power consumption matters because no one has ever measured it or communicated the cost. The solution is not to blame operators but to make the cost visible and provide alternatives. Automatic power-down after a configurable idle period eliminates the behavior dependency entirely by turning off non-essential systems after 5 to 15 minutes of inactivity while keeping the forklift ready to reactivate within seconds when the operator resumes.
Quantifying Idle Waste by Shift Pattern
| Shift Pattern | Avg Idle Hours per Forklift per Day | Daily Idle Energy Waste (30 Fleet) | Annual Idle Cost (30 Fleet) |
|---|---|---|---|
| Single Shift (8 hr) | 2.5 to 3.5 hours | 60 to 84 kWh | 1750 to 3700 dollars |
| Two Shift (16 hr) | 5 to 7 hours | 120 to 168 kWh | 3500 to 7350 dollars |
| Three Shift (24 hr) | 7 to 10 hours | 168 to 240 kWh | 4900 to 10500 dollars |
| Two Shift with Breaks Left On | 7 to 9 hours | 168 to 216 kWh | 4900 to 9450 dollars |
Battery State-of-Charge Mismanagement
Battery state-of-charge management directly affects both energy efficiency and battery longevity. The optimal operating range for lead-acid forklift batteries is between 20 and 80 percent state-of-charge. Operating consistently above 80 percent increases plate corrosion and water consumption. Operating consistently below 20 percent causes deep discharge sulfation that permanently reduces capacity. Yet many plants have no visibility into where their batteries actually operate within this range on a daily basis.
The Deep Discharge Penalty
When a lead-acid battery discharges below 20 percent state-of-charge, lead sulfate crystals form on the plates in a hard, dense configuration that resists reversion during normal charging. Each deep discharge event permanently reduces battery capacity by 1 to 3 percent. A battery that experiences deep discharge twice weekly loses 2 to 6 percent capacity per month or 24 to 72 percent over a year. In practice, this manifests as shorter shift runtime, more frequent charging, and ultimately premature replacement. The energy waste comes from the fact that a degraded battery must be charged more frequently to deliver the same work, increasing total charging energy consumption by 10 to 20 percent compared to a properly managed battery. FleetRabbit monitors state-of-charge in real time and alerts operators and supervisors before batteries reach the dangerous deep-discharge threshold, preventing the degradation cycle before it starts.
State-of-Charge Tracking Without Battery Monitors
Not every electric forklift has a factory-installed battery monitor that reports precise state-of-charge. FleetRabbit estimates state-of-charge by tracking cumulative discharge time and work intensity between charge cycles, correlated with known battery capacity specifications for each vehicle. While not as precise as a direct cell-level measurement, this method provides sufficient accuracy to identify batteries that consistently operate in the danger zones below 20 percent or above 90 percent. Plants can then prioritize which forklifts need battery monitor retrofits or replacement based on actual operating pattern data rather than guesswork.
Overcharge Damage and Energy Loss
Sustained operation above 90 percent state-of-charge increases internal battery temperature and accelerates positive plate corrosion. The energy waste comes from two mechanisms. First, the charger continues delivering energy that the battery cannot accept, converting it to heat instead of stored chemical energy. Second, the elevated temperature increases self-discharge rate, meaning the battery loses stored energy faster and requires more frequent recharging to maintain readiness. Plants that keep forklifts on charge continuously during non-working hours like weekends and holidays experience significant overcharge waste because the batteries reach full charge within 8 to 10 hours but remain connected to chargers for 48 to 72 hours. Smart charging systems that disconnect after reaching full charge and reconnect only when state-of-charge drops below a threshold eliminate this waste entirely.
FleetRabbit identifies overcharging, idle waste, deep discharges, and uncoordinated charging peaks across your electric forklift fleet. Get a clear energy waste score for every vehicle, every shift, every day. Take the guesswork out of energy cost reduction with data you can act on immediately.
Charging Schedule Optimization: The Highest-ROI Energy Strategy
Of all the energy waste reduction strategies available, charging schedule optimization delivers the fastest return with the lowest implementation effort. The concept is straightforward: spread charging activity across available time windows to minimize peak demand and eliminate simultaneous charging spikes. The execution requires coordination that becomes practical only with fleet-level visibility into which forklifts need charging, how much charge they need, and when charging can occur without disrupting operations.
Staggered Charging Versus Batch Charging
Batch charging occurs when all forklifts plug in at approximately the same time, typically at shift end. This creates a massive combined load that peaks within the first hour and then tapers as batteries fill. Staggered charging spaces out the start times so that only a subset of chargers are drawing peak current at any given moment. The total energy delivered is identical, but the peak demand is reduced by 40 to 60 percent. For a plant paying a demand charge of 12 to 18 dollars per kilowatt, reducing peak charging demand from 200 kilowatts to 90 kilowatts saves 1320 to 1980 dollars per month or 15840 to 23760 dollars annually. This savings requires no equipment changes, no operator behavior changes beyond following a slightly different plug-in schedule, and no reduction in forklift availability. It is purely a coordination improvement enabled by visibility into charging patterns.
Off-Peak Charging Window Exploitation
Many industrial electricity tariffs offer significantly lower energy rates during off-peak hours, typically between 9 PM and 6 AM. If a plant's shift schedule allows forklifts to complete charging during these hours, the per-kilowatt-hour cost drops by 30 to 50 percent compared to on-peak rates. A 30-fleet operation consuming 500000 kilowatt-hours annually for charging at an average blended rate of 0.10 dollars per kilowatt-hour spends 50000 dollars. Shifting 60 percent of that charging to off-peak windows at 0.06 dollars per kilowatt-hour saves 12000 dollars annually with no change in total energy consumed. FleetRabbit's charging schedule optimizer identifies which forklifts can shift to off-peak windows based on their state-of-charge at shift end and their next required operational time.
Building a Charging Schedule That Actually Works
An effective charging schedule must account for operational reality, not just theoretical optimization. Forklifts that start first shift at 6 AM must be fully charged by 5:45 AM regardless of off-peak rate windows. Forklifts used across multiple shifts may only have narrow charging windows between shift changes. Batteries with degraded capacity need longer charge times than new batteries, affecting when they must start charging to be ready for their next assignment. FleetRabbit builds charging schedules that respect all these constraints while still minimizing peak demand and maximizing off-peak charging exploitation. The schedule adapts automatically as battery conditions change and shift patterns shift, eliminating the manual scheduling effort that makes static charging schedules fail within weeks of implementation.
Lithium-Ion Versus Lead-Acid: Energy Efficiency Comparison
The decision to deploy lithium-ion versus lead-acid batteries significantly impacts total energy consumption and waste potential. While lithium-ion batteries carry higher upfront costs, their superior charging efficiency and tolerance for opportunity charging create meaningful energy savings over the battery lifecycle. Understanding the energy dimension of this comparison helps plants make informed fleet decisions rather than focusing solely on purchase price.
| Energy Factor | Lead-Acid | Lithium-Ion | Energy Impact |
|---|---|---|---|
| Charging Efficiency | 75 to 82 percent | 92 to 96 percent | Lithium saves 12 to 18 percent on charging energy per cycle |
| Opportunity Charging | Reduces battery life 40 to 60 percent | No degradation impact | Lithium enables opportunity charging without battery replacement cost |
| Overcharging Waste | 8 to 12 percent per cycle possible | Near zero, BMS terminates charge | Lithium eliminates overcharging waste entirely |
| Usable Capacity Window | 20 to 80 percent recommended | 10 to 90 percent safe range | Lithium provides 25 to 30 percent more usable capacity per charge |
| Battery Lifespan | 5 to 7 years with proper care | 8 to 12 years typical | Longer life reduces replacement energy embedded in manufacturing |
Building an Energy Reduction Roadmap for Your Fleet
Reducing forklift energy waste does not require a massive capital investment or a complete fleet replacement. The most effective approach follows a phased roadmap that captures quick wins first and builds toward systematic optimization over 90 to 180 days.
Phase One: Visibility and Quick Wins (Weeks 1 to 4)
Deploy fleet-level energy tracking to establish baseline measurements for charging energy, idle power consumption, and battery state-of-charge patterns. Within the first two weeks of data collection, quick wins become visible. Identify forklifts with the highest idle hours and implement power-down policies or automatic shutoff. Identify chargers that run significantly longer than battery capacity suggests and adjust charger settings. Identify the specific shift-change window where batch charging occurs and begin manual staggering. These quick wins typically reduce total energy consumption by 8 to 12 percent with minimal effort because the data tells you exactly where to look.
Phase Two: Schedule Optimization and Behavior Change (Weeks 5 to 8)
Implement automated charging schedule optimization that staggers charge start times across available windows. Train operators on proper power-down procedures during breaks and end-of-shift protocols. Establish state-of-charge thresholds that trigger charging before batteries reach deep-discharge levels. Communicate energy cost data to operators so they understand the financial impact of idle time and charging behavior. Behavior change driven by visible data is far more effective than behavior change driven by memos and reminders. When operators see that their forklift consumed 12 dollars of idle energy last week, the behavior adjusts naturally without enforcement.
Phase Three: Systematic Optimization and Fleet Decisions (Weeks 9 to 24)
Analyze 60 to 90 days of accumulated data to make informed fleet-level decisions. Identify forklifts where battery replacement would deliver immediate energy efficiency improvement because degraded batteries are consuming excess charging energy. Evaluate which fleet segments would benefit most from lithium-ion conversion based on actual opportunity charging needs and charging pattern data. Calculate the total cost of ownership comparison including energy waste for each fleet segment. This phase transforms energy reduction from individual behavior changes into structural fleet decisions that lock in savings for years. Plants completing all three phases typically achieve 20 to 30 percent total energy reduction compared to their pre-optimization baseline. Sign up for FleetRabbit to start your energy reduction roadmap with real data from day one.
Energy waste hides inside charging patterns, idle hours, and battery mismanagement that no utility bill can reveal. FleetRabbit makes every wasted kilowatt-hour visible, quantifiable, and fixable. Plants using FleetRabbit reduce electric forklift energy costs by 18 to 30 percent within the first quarter through data-driven charging optimization, idle elimination, and battery health protection. Start seeing your energy waste today.







