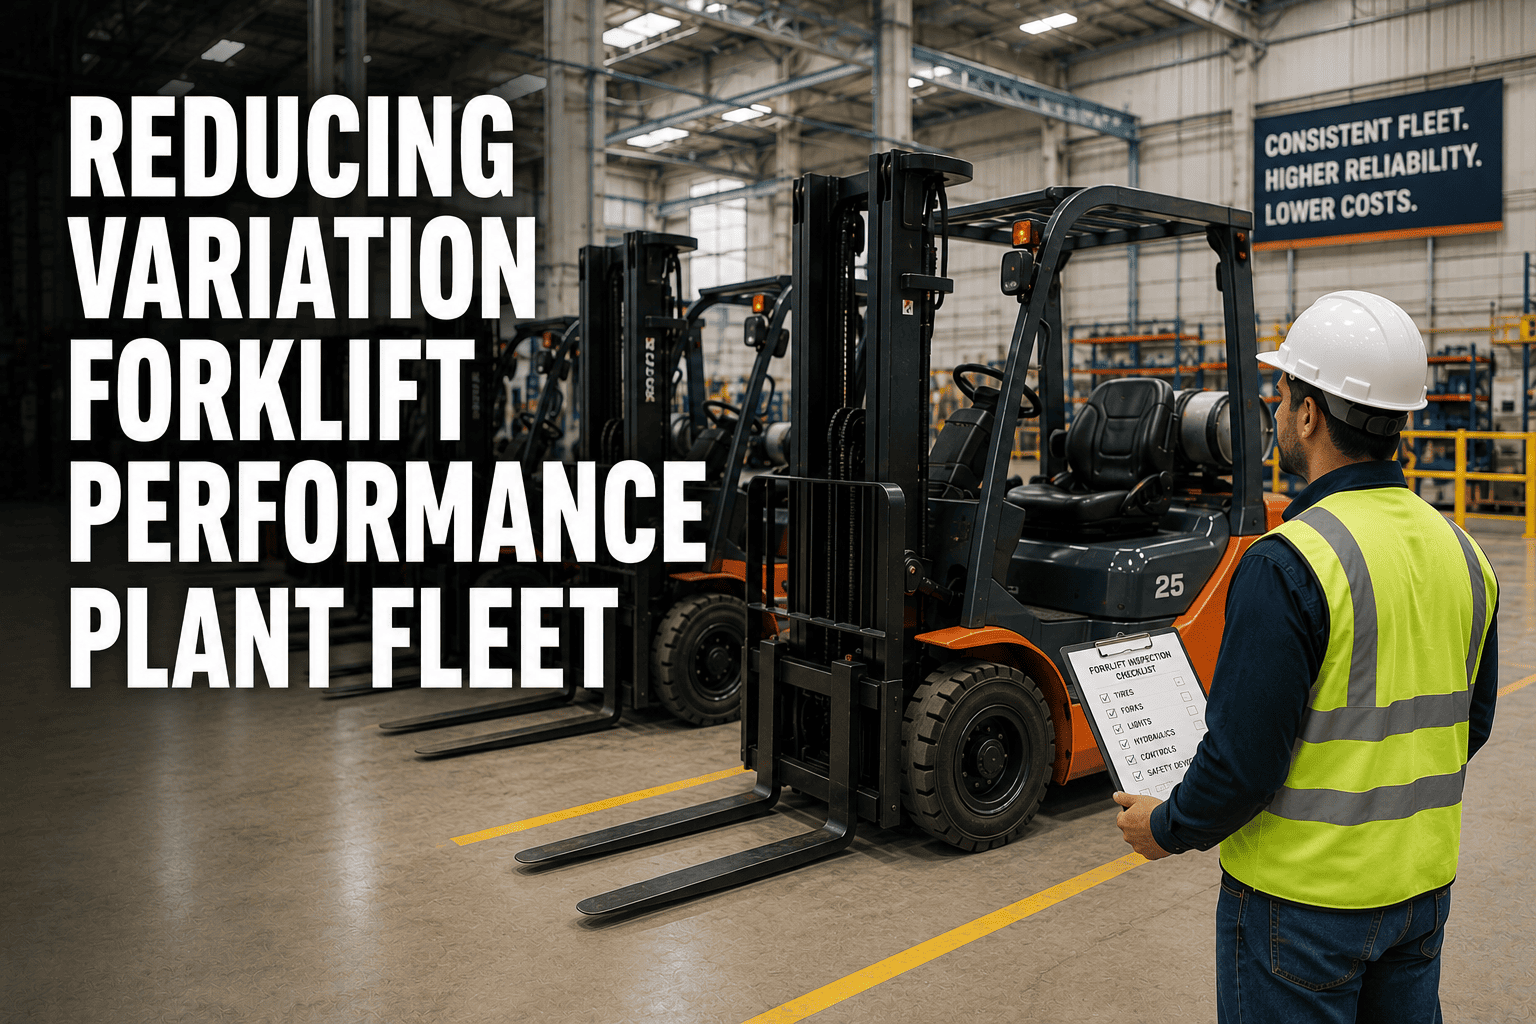
In a manufacturing plant, identical forklifts often perform very differently. One truck might run flawlessly for 5,000 hours, while another of the same model becomes a chronic lemon. This performance variation destroys cost-per-hour metrics and stalls production. Reducing variation in forklift performance across the plant fleet is essential for efficiency. FleetRabbit benchmarks truck-by-truck so you find the underperformers and the operator and maintenance gaps behind them. You can sign up for FleetRabbit to modernize your plant, or book a demo to see our platform.
Identical forklifts often have a 30 to 40 percent variation in cost-per-hour and uptime. Plants rely on fleet averages, hiding chronic lemons and operator abuse. Implementing truck-by-truck benchmarking exposes these underperformers, allowing plants to standardize maintenance and cut total fleet costs by 20 percent.
The True Cost of Performance Variation
The true cost of performance variation extends far beyond the immediate repair bill of a single lemon truck. When a manufacturing plant accepts that some trucks are just "bad," the financial damage ripples across the entire operation. The immediate loss of capital is obvious, but secondary costs often exceed the primary impact. A chronic lemon truck spends more time in the shop than on the floor, forcing other trucks to absorb its workload. This overworking accelerates wear on the good trucks, dragging the whole fleet's performance down. Furthermore, relying on fleet averages hides the outliers, preventing managers from making data-driven replacement decisions.
Why Identical Forklifts Perform Differently
Identical forklifts perform differently because of three hidden variables: maintenance quality, operator behavior, and duty cycles. A truck assigned to a heavy-duty shipping dock will fail faster than the same truck assigned to a light-assembly line. Furthermore, if one operator habitually slams the forks into the ground, that truck will suffer drivetrain and mast failures that identical trucks do not. Without a system that tracks these variables truck-by-truck, management cannot tell if a failure is caused by a bad machine, a bad operator, or a bad assignment.
The Danger of Averages
The danger of averages is that they hide the truth. If a plant has 10 forklifts and the average cost-per-hour is 4 dollars, management assumes everything is fine. However, 8 of those trucks might cost 2 dollars per hour, while 2 lemons cost 12 dollars per hour. The average hides the 2 massive drains on the budget. Without truck-by-truck benchmarking, the plant will continue to pour money into the 2 lemons, thinking they are performing at the fleet average. To fix this, you can sign up for FleetRabbit to modernize your plant, or book a demo to see our platform.
FleetRabbit benchmarks performance truck-by-truck, exposing the lemons and the operator abuse behind them. Stop relying on averages and start standardizing your fleet. Start your free trial today to find your underperformers.
Strategies for Performance Benchmarking
Effective performance benchmarking requires a shift from aggregated accounting to granular, asset-level tracking. The first strategy is tracking true cost-per-hour per truck, not just fleet averages. The second strategy is linking telematics to maintenance, ensuring every impact and hour is tied to a specific asset. The third strategy is enforcing operator accountability, using PIN access to identify drivers who abuse equipment. By executing these strategies, plants eliminate the hidden variables that cause performance variation.
| Performance Metric | Variation Cause | Visibility Flaw | FleetRabbit Solution |
|---|---|---|---|
| Cost Per Hour | Chronic lemon components | Fleet averages hide high-cost trucks | Per-asset cost tracking and alerts |
| Uptime Rate | Unbalanced duty cycles | No visibility into asset workloads | Engine hour balancing reports |
| Impact Events | Aggressive driving habits | No way to prove who was driving | Operator PINs and impact alerts |
| Battery Life | Chronic idle and deep discharge | Battery cycles not tracked per asset | Battery health monitoring per truck |
| Maintenance ROI | Reactive symptom-fixing | Failure history not benchmarked | Standardized PM templates per model |
Linking Telematics to Maintenance
Linking telematics to maintenance is the most critical step in eliminating performance variation. A failure history database connects every work order, engine hour, and impact event to a specific forklift. FleetRabbit's system uses this data to benchmark trucks against each other. When a specific truck starts requiring 3x the parts of an identical model, the system flags it as an outlier. This connection ensures the plant manager has the exact data needed to investigate the root cause—whether it is a bad operator, a bad assignment, or a bad truck.
Identifying Underperformers
Identifying underperformers means catching the lemons before they drain the budget. FleetRabbit's dashboard analyzes the entire fleet and ranks trucks by cost-per-hour and uptime. If 8 trucks are at 3 dollars per hour and 2 are at 8 dollars per hour, the 2 outliers are instantly visible. The plant can then investigate those specific trucks. Are they assigned to the heaviest dock? Are they driven by the most aggressive operators? If the truck is just a lemon, the data justifies replacing it, saving thousands in avoided repairs.
Enforcing Operator Accountability
Enforcing operator accountability is key to stopping behavior-induced variation. If a specific truck is experiencing chronic mast failures, the data might show it is always driven by the same operator. FleetRabbit uses operator-specific PINs, tying every impact and hour to a specific driver. If the data proves the operator is abusing the equipment, the plant can coach or discipline them. This ensures that performance variation is caused by the machine, not by hidden human error. To enforce this, you can sign up for FleetRabbit to modernize your plant, or book a demo to see our platform.
How FleetRabbit Standardizes the Fleet
FleetRabbit is engineered to connect the plant floor directly to performance metrics. Our platform combines telematics, work order management, and operator tracking into a single dashboard. We understand that performance variation is a symptom of hidden variables. Our system benchmarks trucks against each other, ensuring managers can see exactly which assets are underperforming and why. By connecting the operator to a centralized digital record, FleetRabbit eliminates the blind spots that cause performance gaps.
Truck-By-Truck Dashboards
Truck-by-truck dashboards mean the plant manager no longer relies on fleet averages. The FleetRabbit dashboard displays a color-coded grid of all forklifts, ranked by cost-per-hour and uptime. Green trucks are performing well, yellow trucks need attention, and red trucks are chronic lemons. This visual simplicity allows a manager to instantly spot the 2 underperforming trucks out of a fleet of 20. It also tracks the root cause, showing if the red status is caused by high parts cost, low uptime, or chronic impacts.
Balancing Duty Cycles
Balancing duty cycles is a key benefit of granular visibility. If an executive sees that Truck A has 3,000 engine hours and Truck B has 1,000, they know the workloads are unbalanced. This causes Truck A to wear out prematurely. FleetRabbit tracks true engine hours, allowing dispatchers to balance the workload across the fleet. By rotating trucks through heavy and light duty cycles, the plant ensures that wear is distributed evenly, standardizing performance and extending the life of the entire fleet. This data-driven approach prevents unnecessary capital expenditures and keeps the fleet running smoothly.
Key Takeaways for Plant Efficiency
Reducing variation in forklift performance is the most critical step in maximizing manufacturing efficiency and protecting the maintenance budget. Relying on fleet averages and ignoring operator behavior is a guaranteed way to overspend on lemons and stall production lines. A granular, data-driven approach to benchmarking ensures every truck is measured and every operator is accountable. Plants that fix this process see a massive reduction in repair costs and a huge boost in capital efficiency.
Implementing a comprehensive platform like FleetRabbit benchmarks truck-by-truck, links telematics to maintenance, and enforces operator accountability. The return on investment is immediate, not just in saved repair costs, but in eliminated bad investments, improved safety, and extended asset lifecycles. Manufacturing plants demand reliability, and FleetRabbit provides the exact digital tools needed to deliver it.
The path forward is clear. Evaluate your current fleet and ask if you can identify your specific lemon trucks. If you are relying on averages, you are losing money. Plant managers who address performance variation systematically protect their profitability and operational reliability. You can sign up for FleetRabbit to modernize your plant, or book a demo to see our platform.
Frequently Asked Questions About Performance
Every day you rely on fleet averages is a day you overspend on hidden lemons. FleetRabbit benchmarks performance truck-by-truck, exposing the underperformers and the abuse behind them. See a 20 percent reduction in fleet costs within weeks. Start your free trial today with no credit card required.