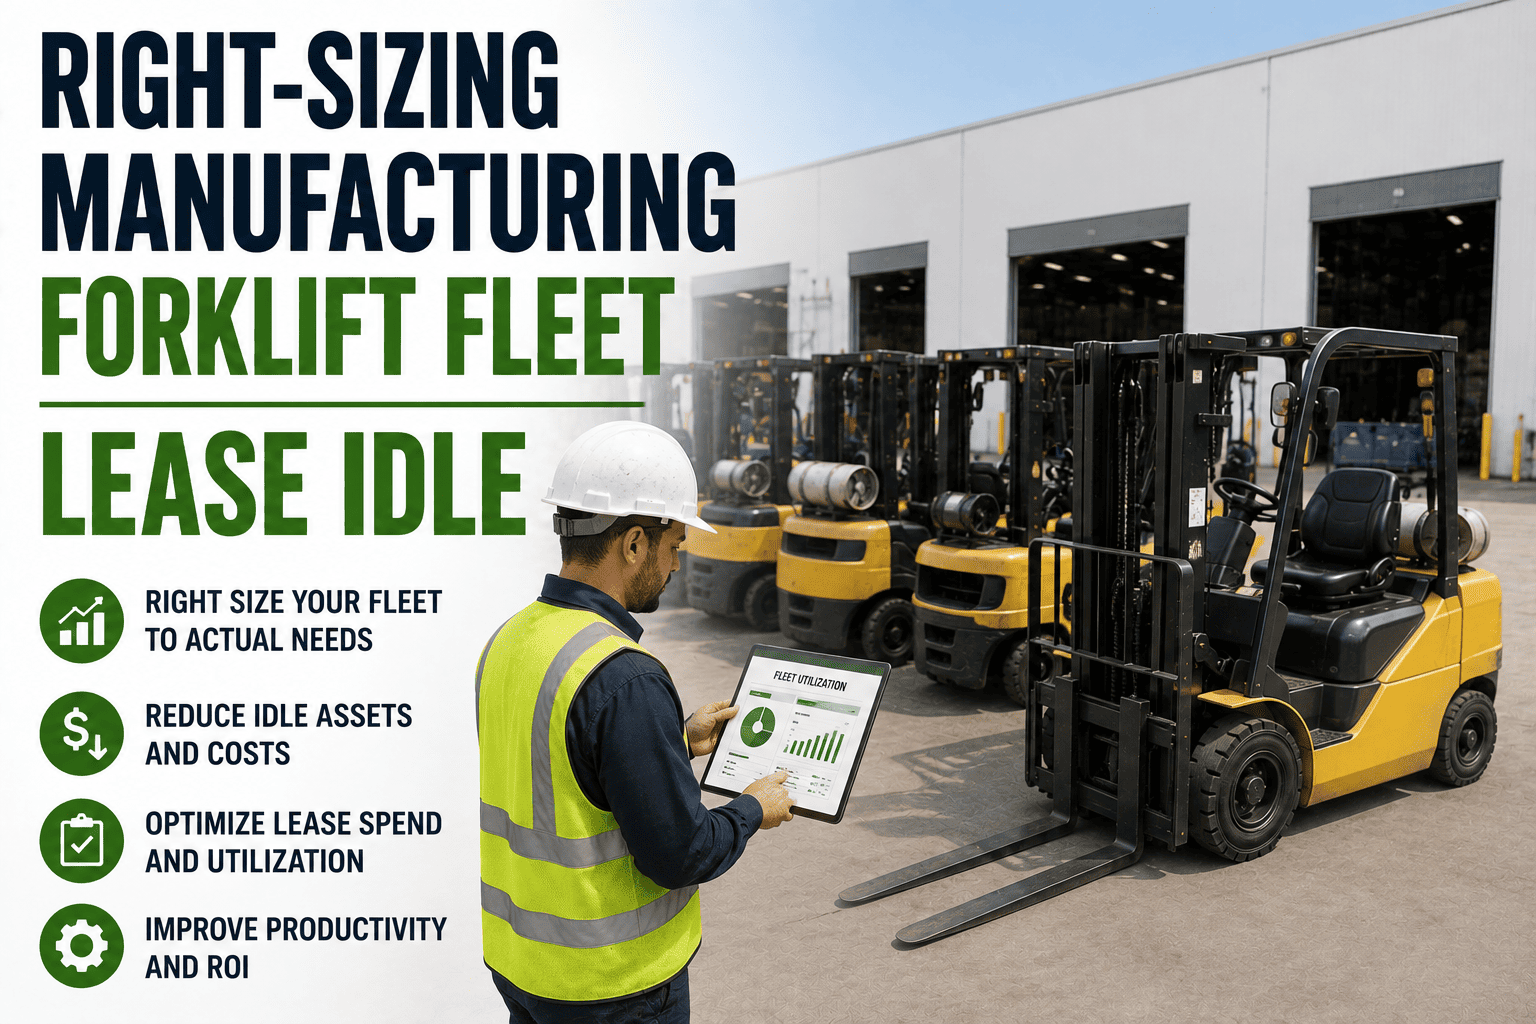
Ask five plant managers how many forklifts they need and you will likely get five different answers, none of them backed by a calculation. Most fleets are sized the way they grew: a truck added here for a new line, another kept "just in case" after a busy season, a third never removed after a shift was cut. Nobody sat down and worked out the actual number. The result is a fleet that is almost never the right size. Either too many trucks sit idle burning lease and maintenance dollars, or too few trucks force operators to wait, queue, and slow the entire floor down. Right-sizing means matching fleet size to real, measured demand instead of habit.
A right-sized forklift fleet keeps utilization in the 60 to 80 percent range of available shift hours. Below that band, you likely have more trucks than your operation needs. Above it, you are running the fleet too hard, which accelerates wear and raises breakdown risk. A single forklift can cost more than 200,000 dollars a year to operate in a three-shift environment, and most fleet optimization efforts recover 10 to 20 percent of operating cost simply by matching truck count and shift coverage to actual measured demand.
Two Ways a Fleet Gets the Size Wrong
Fleet size rarely drifts in only one direction. Some zones of a plant are overfleeted while others are stretched thin, and both problems can exist in the same building at the same time. Seeing both sides clearly is the first step toward fixing either one.
- Trucks average well under 60 percent utilization across shifts
- Lease, insurance, and depreciation cost accumulate on idle units
- More equipment competes for the same aisle and dock space
- Maintenance budgets spread thin servicing trucks that barely run
- Operators queue and wait for an available truck during peak hours
- Remaining trucks run above 80 percent utilization, accelerating wear
- Rush periods slip, delaying downstream production and shipping
- Breakdown risk climbs as the few available units are pushed harder
Why Both Problems Cost More Than They Look Like
An overfleeted zone hides its cost inside monthly lease statements that nobody questions once they become routine. An underfleeted zone hides its cost inside operator wait time and missed throughput that rarely gets tracked back to fleet size at all. Both are real, measurable losses, and both are solvable once utilization data replaces assumption.
The Right-Size Zone
Utilization benchmarks for forklift fleets generally point to the same target range. Staying inside it is what separates a right-sized fleet from one that is quietly wasting money in either direction.
Utilization below 60 percent generally signals more trucks than the operation needs. Utilization consistently above 80 percent generally signals too few trucks carrying too much load. The target range in between is where fleet size, cost, and equipment life all balance out.
FleetRabbit tracks utilization per unit, per zone, and per shift, so you can see exactly where your fleet sits against the right-size range instead of guessing. Sign up free and map your fleet's utilization today.
How to Calculate the Fleet Size You Actually Need
Right-sizing is a calculation, not a guess. It starts with how many operators and shifts you actually run, then works backward to the truck count that supports them without excess or shortfall.
Building the Demand Picture Before You Cut or Add Trucks
A fleet size calculation is only as good as the demand data behind it. Layout, travel distance, peak-period volume, and how many cycles each truck can realistically complete per hour all shape the real number, which is why a single company-wide ratio rarely fits every zone of a plant equally well.
What Right-Sizing Actually Recovers
Material handling activity accounts for a meaningful share of total manufacturing operating cost in most production environments, and forklift fleet cost flows into that number through three lines: operator labor, maintenance labor, and equipment cost itself. Getting fleet size wrong inflates all three at once, and correcting it tends to deliver savings quickly once the data is in hand.
| Cost Line | Impact When Overfleeted | Impact When Underfleeted |
|---|---|---|
| Lease and Depreciation | Paying full cost for trucks producing little output | Emergency rentals brought in at premium short-term rates |
| Maintenance | Budget spread thin servicing rarely-used equipment | Remaining trucks wear out faster from overuse, raising repair frequency |
| Labor | Idle capital tied up instead of funding productive headcount | Operators lose paid hours waiting for an available truck |
| Throughput | Extra equipment congesting aisles without adding output | Peak-period orders and shipments slip behind schedule |
A Four-Step Right-Sizing Process
A Note on Seasonal and Peak Swings
Not every gap should be closed with a permanent truck. Businesses with seasonal peaks and lulls are often better served by short-term rentals or flexible leases during the spike, keeping the core fleet sized for typical demand rather than the busiest week of the year.
FleetRabbit shows exactly which zones are overfleeted, which are stretched thin, and where rebalancing existing trucks can close the gap before you spend on a new lease. Book a free demo to walk through your own zone-level utilization data.
How FleetRabbit Supports Ongoing Right-Sizing
Right-sizing is not a project you finish once. Product mix changes, shifts get restructured, and new lines get added, all of which shift the true fleet number without anyone updating a spreadsheet to match. FleetRabbit keeps utilization visible continuously across every unit, zone, and shift, so overfleeted and underfleeted areas surface on their own instead of waiting for a manual review. Fleet and finance teams can see the right-size band applied to their own data in real time, making the case for rebalancing, renting, or leasing with evidence instead of estimation. You can start a free trial to see your current fleet mapped against the right-size zone, or book a demo for a guided walkthrough of your own numbers.
Frequently Asked Questions
Demand shifts constantly, but most fleet counts only get revisited when a lease happens to come up for renewal. FleetRabbit gives you continuous, zone-level utilization data so every truck added, kept, or removed is a decision backed by evidence instead of habit.