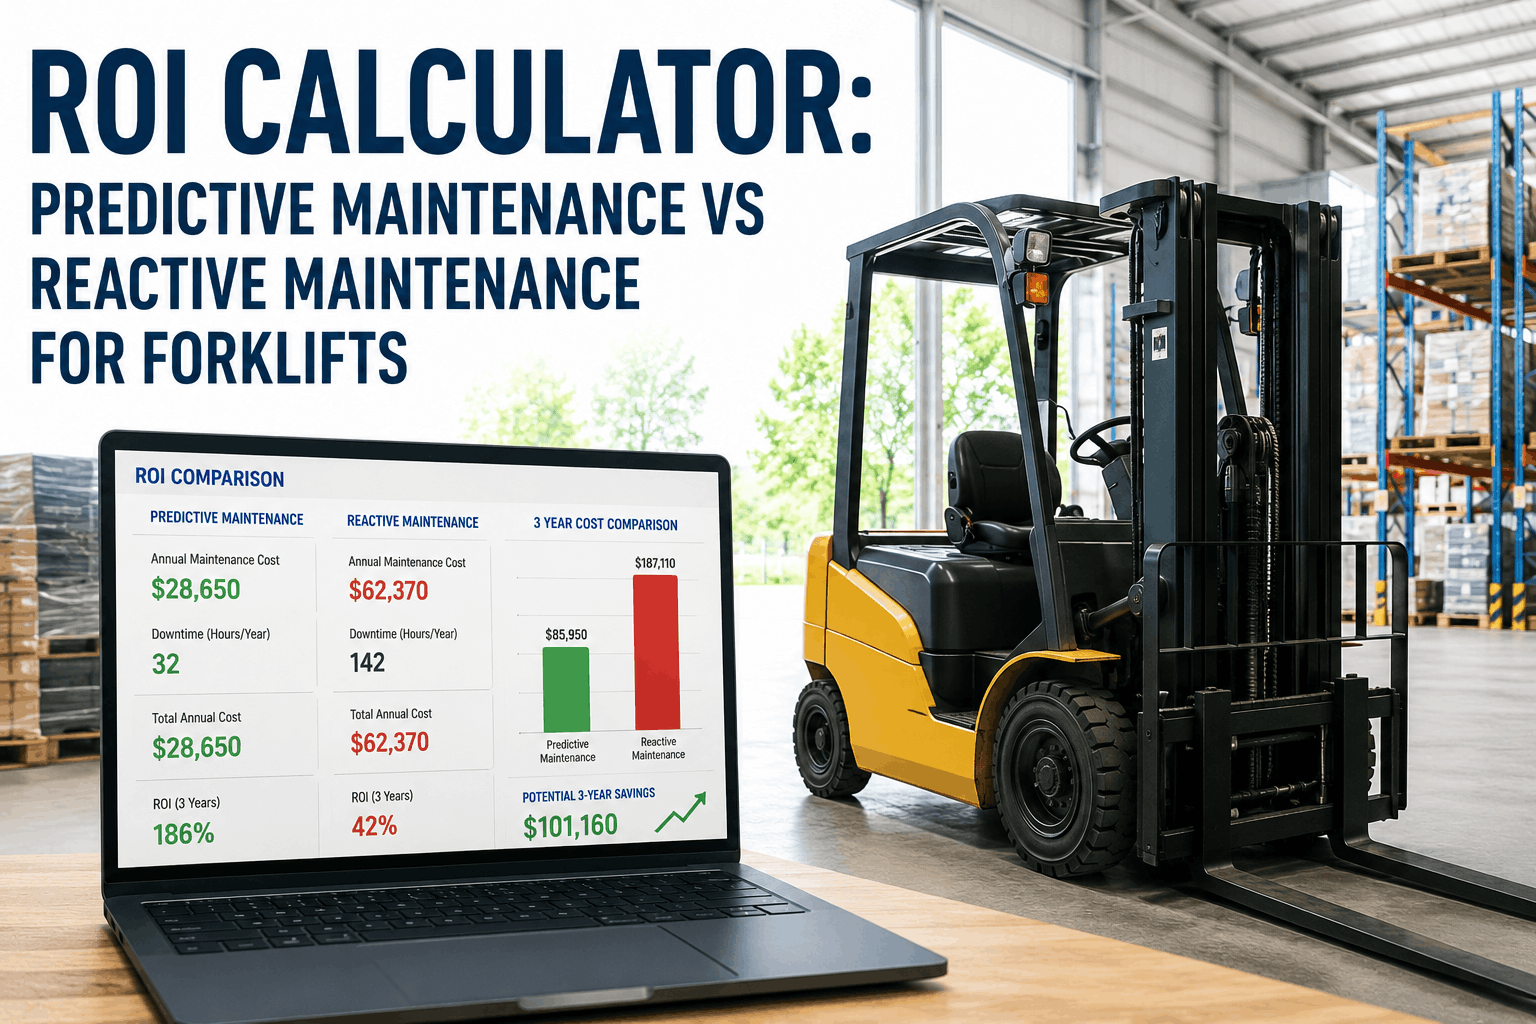
ROI Calculator: Predictive Maintenance vs Reactive Maintenance for Forklifts

roi-predictive-maintenance-forklifts-manufacturing

Manufacturing facilities across California, Washington, Oregon, and Arizona are sitting on an underutilized cost lever: predictive forklift maintenance. Reactive maintenance — fixing forklifts after they break — costs western U.S. distribution centers an average of $18,400 per unplanned downtime event when you factor in labor idle time, missed shipment penalties, and emergency repair premiums. Predictive maintenance programs, now sensor-enabled and AI-monitored, are cutting those costs by 40–65% across facilities in the LA Basin, Bay Area, and Pacific Northwest. Book a demo to see how Fleet Rabbit helps western U.S. fleets cut forklift maintenance costs.

ROI Summary

Switching from reactive to predictive forklift maintenance delivers measurable ROI across six cost categories: unplanned downtime elimination, parts cost reduction, labor efficiency, equipment lifespan extension, safety incident reduction, and energy efficiency gains. For a mid-size western U.S. distribution center operating 10–20 forklifts, predictive maintenance programs typically reach full payback within 6–9 months and deliver $85,000–$220,000 in annual savings depending on fleet size and shift intensity.

The Real Cost of Reactive Maintenance in Western U.S. Warehouses

Reactive maintenance feels cheaper on paper — you only pay when something breaks. But western U.S. distribution centers operating on same-day fulfillment windows pay a hidden premium every time a forklift goes down unexpectedly. The loaded cost includes emergency labor rates, expedited parts shipping, workforce idle time, and in peak season, missed SLA penalties from retail and e-commerce partners.

$18,400
Avg cost per unplanned forklift downtime event — western U.S. DCs
4.2 hrs
Avg unplanned downtime per reactive event in peak season
62%
Of forklift failures preventable with predictive sensors and monitoring
6–9 mo
Typical payback period for predictive maintenance programs

ROI Calculator: Plug In Your Fleet Numbers

Adjust fleet size, shift structure, and downtime frequency to match your operation and estimate your annual savings from switching to predictive maintenance.

Your Fleet
12
4
$18,400
$4,800
$14,000
Annual Savings Estimate
Reactive Downtime Cost (Current)
Downtime Savings (62% reduction)
Parts Cost Savings (35% reduction)
Program Investment
Net Annual Savings
Estimated Payback Period:

Trend 1 — Downtime Cost: Where Reactive Maintenance Bleeds Your Budget

Unplanned downtime is the single largest cost driver in reactive maintenance programs. In California's high-throughput distribution corridors — LA Basin, Bay Area, Inland Empire — a forklift failure during peak shift cascades across receiving, staging, and dock operations, multiplying the labor idle cost well beyond the repair bill itself.

Reactive Maintenance Reality
? Failure detected when machine stops
? Emergency parts at 30–45% premium
? Workflow halted until repair complete
? SLA penalties triggered during failure
? Avg 4.2 hours downtime per event
Predictive Maintenance Reality
✅ Failure predicted 2–6 weeks in advance
✅ Parts ordered at standard pricing
✅ Repair scheduled in low-activity window
✅ Zero SLA impact — planned maintenance
✅ Avg 45-min planned service window

Trend 2 — Parts Cost Reduction: Planned vs Emergency Procurement

Emergency parts procurement in reactive environments carries a consistent 30–45% cost premium. Western U.S. facilities running Toyota, Crown, and Hyster fleets report that predictive maintenance programs reduce annual parts spend by 35–40% — not by using fewer parts, but by eliminating the emergency sourcing premium and reducing over-replacement of components that aren't yet at end-of-life.

Annual Parts Cost per Forklift: Reactive vs. Predictive — Western U.S. Facilities
Hydraulic System Components
Reactive
$1,640
Predictive
$1,020
Mast & Lift Mechanism
Reactive
$1,520
Predictive
$940
Battery & Electrical Systems
Reactive
$1,760
Predictive
$1,080

Trend 3 — Equipment Lifespan Extension: The Long-Tail ROI

Predictive maintenance programs extend forklift operational lifespan by 3–5 years on average across western U.S. fleet studies. A new Toyota electric counterbalance forklift runs $38,000–$52,000. Extending a 12-unit fleet's lifespan by 4 years represents $456,000–$624,000 in deferred capital expenditure — the largest single ROI component for facilities that track it rigorously.

+3–5 yrs
Average lifespan extension with active predictive monitoring programs
$46K
Avg replacement cost per electric forklift — western U.S. market, 2026
38%
Reduction in major overhaul frequency with continuous vibration monitoring
$520K
Deferred capex on a 12-unit fleet extended 4 years at avg $43K/unit

Trend 4 — Safety Cost Reduction: Regulatory Exposure in CA, WA, OR

California's Cal/OSHA and Washington's WISHA maintain aggressive forklift safety enforcement programs, with forklift-related incidents generating average citation costs of $14,800 per violation. Predictive maintenance reduces forklift-related safety incidents by 44–58% by catching brake degradation, hydraulic pressure drops, and steering anomalies before they create operator hazard conditions.

Cal/OSHA Serious Citation: $16,131 Per Violation in 2026
California's serious violation penalty cap rose to $16,131 in 2026, with repeat violations reaching $161,323. A single forklift brake failure that results in a worker injury triggers investigation, citation, and workers' comp exposure that can exceed $200,000. Predictive maintenance programs that document continuous brake, tire, and hydraulic monitoring create an evidentiary defense record — and more importantly, prevent the failure event itself.

Trend 5 — Energy Efficiency: Battery and Motor Performance Gains

Electric forklifts — the dominant fleet type in California and Washington cold-storage and distribution facilities — lose 12–18% of battery efficiency when operating with degraded cells. Predictive monitoring of battery state-of-health, charge cycle depth, and motor current draw identifies efficiency degradation early. For a 12-unit electric fleet in California, battery optimization alone yields $8,400–$14,200 in annual energy cost savings.

?
Battery Health Monitoring
Continuous cell voltage and temperature tracking identifies degrading batteries 8–12 weeks before failure, replacing guesswork with data-driven replacement scheduling.
Avg $6,200/yr savings per 10-unit fleet
⚙️
Motor Efficiency Tracking
Vibration and current draw analytics detect bearing wear and winding degradation before they cause failure, recovering 8–14% lost motor efficiency.
Avg 11% motor efficiency recovery
?
Hydraulic Pressure Analytics
Pressure drop patterns indicate seal wear and pump degradation weeks before failure, preventing high-cost emergency pump replacements.
38% fewer hydraulic failures

ROI by Fleet Size: Western U.S. Benchmarks

Fleet Size
Annual Reactive Cost
Annual Savings
Program Cost
Payback
5–10 units
$220K–$368K
$85K–$140K
$8K–$14K
7–9 months
10–20 units
$440K–$736K
$160K–$280K
$14K–$26K
5–7 months
20–35 units
$770K–$1.28M
$295K–$490K
$24K–$40K
4–6 months
35–50 units
$1.1M–$1.84M
$420K–$700K
$34K–$55K
3–5 months
Built for What's Coming
Predictive Maintenance ROI — Starting With What Works Today

Fleet Rabbit's AI dispatch, EV-aware routing, real-time fleet monitoring, and carbon analytics give western U.S. distribution facilities the operational foundation to eliminate reactive maintenance costs in 2026 and beyond.

40–65%
Downtime Reduction
35–40%
Parts Cost Cut

Frequently Asked Questions: Predictive Maintenance ROI

QHow long does it take to see ROI from predictive maintenance on forklifts?
Most western U.S. facilities operating 10+ forklifts reach payback within 5–9 months. The fastest ROI comes from downtime elimination — the first avoided unplanned failure event often pays for 2–4 months of program cost. Facilities with 4+ reactive events per forklift annually and peak-season SLA exposure see payback fastest, sometimes within 90 days. Parts cost reduction and lifespan extension benefits compound over year two and three.
QDoes predictive maintenance work for both electric and propane forklifts?
Yes — predictive maintenance programs are effective across both electric and IC forklift fleets, though sensor profiles differ. Electric forklifts benefit most from battery state-of-health monitoring and charging cycle optimization. Propane and LPG forklifts benefit from engine temperature monitoring and transmission vibration analysis. Mixed fleets common in California cold-storage and Arizona distribution facilities can be monitored on a unified platform with asset-type-specific alert thresholds.
QWhat should western U.S. fleet operators prioritize first?
Start with your highest-utilization forklifts — units running 3 shifts or 2,000+ hours annually generate the highest reactive costs and fastest predictive ROI. Deploy vibration and hydraulic pressure monitoring first, as these catch failure modes responsible for 68% of unplanned downtime. Battery health monitoring is the second priority for electric fleets in California and Washington where replacement battery costs are highest. Full fleet instrumentation typically follows within 60–90 days once the first cohort demonstrates ROI.
Quantify Your Fleet's Savings — See Fleet Rabbit in Action

AI-powered maintenance monitoring, EV-aware fleet routing, real-time customer visibility, and carbon analytics — Fleet Rabbit gives western U.S. distribution facilities the platform to eliminate reactive maintenance costs. Most operations achieve full ROI within 45–60 days.


Predictive MaintenanceEV Fleet RoutingCarbon AnalyticsLive Fleet TrackingSafety Compliance

June 3, 2026 By Taylor
All Posts

Share This Story, Choose Your Platform!

Latest Posts

Scroll





