Most manufacturing plants have no idea how many of their forklifts are actually working. Trucks sit idle in corners, ghost assets hide between departments, and managers buy new equipment simply because they cannot see the capacity they already own. The right utilization software changes everything, exposing idle forklifts and turning raw telemetry into fleet right-sizing decisions. Comparing the top forklift fleet utilization software options for 2026 is essential before investing. FleetRabbit helps manufacturing plants right-size their fleets and cut cost. You can sign up for FleetRabbit to start tracking utilization, or book a demo to see the platform in action.
The average manufacturing forklift is utilized only 40 to 55 percent of available hours. Plants without utilization tracking routinely over-purchase by 20 to 30 percent, tying up capital in idle trucks. Top utilization software exposes idle and ghost assets, enabling fleets to right-size and cut material handling costs by 15 to 25 percent.
What Forklift Utilization Software Actually Does
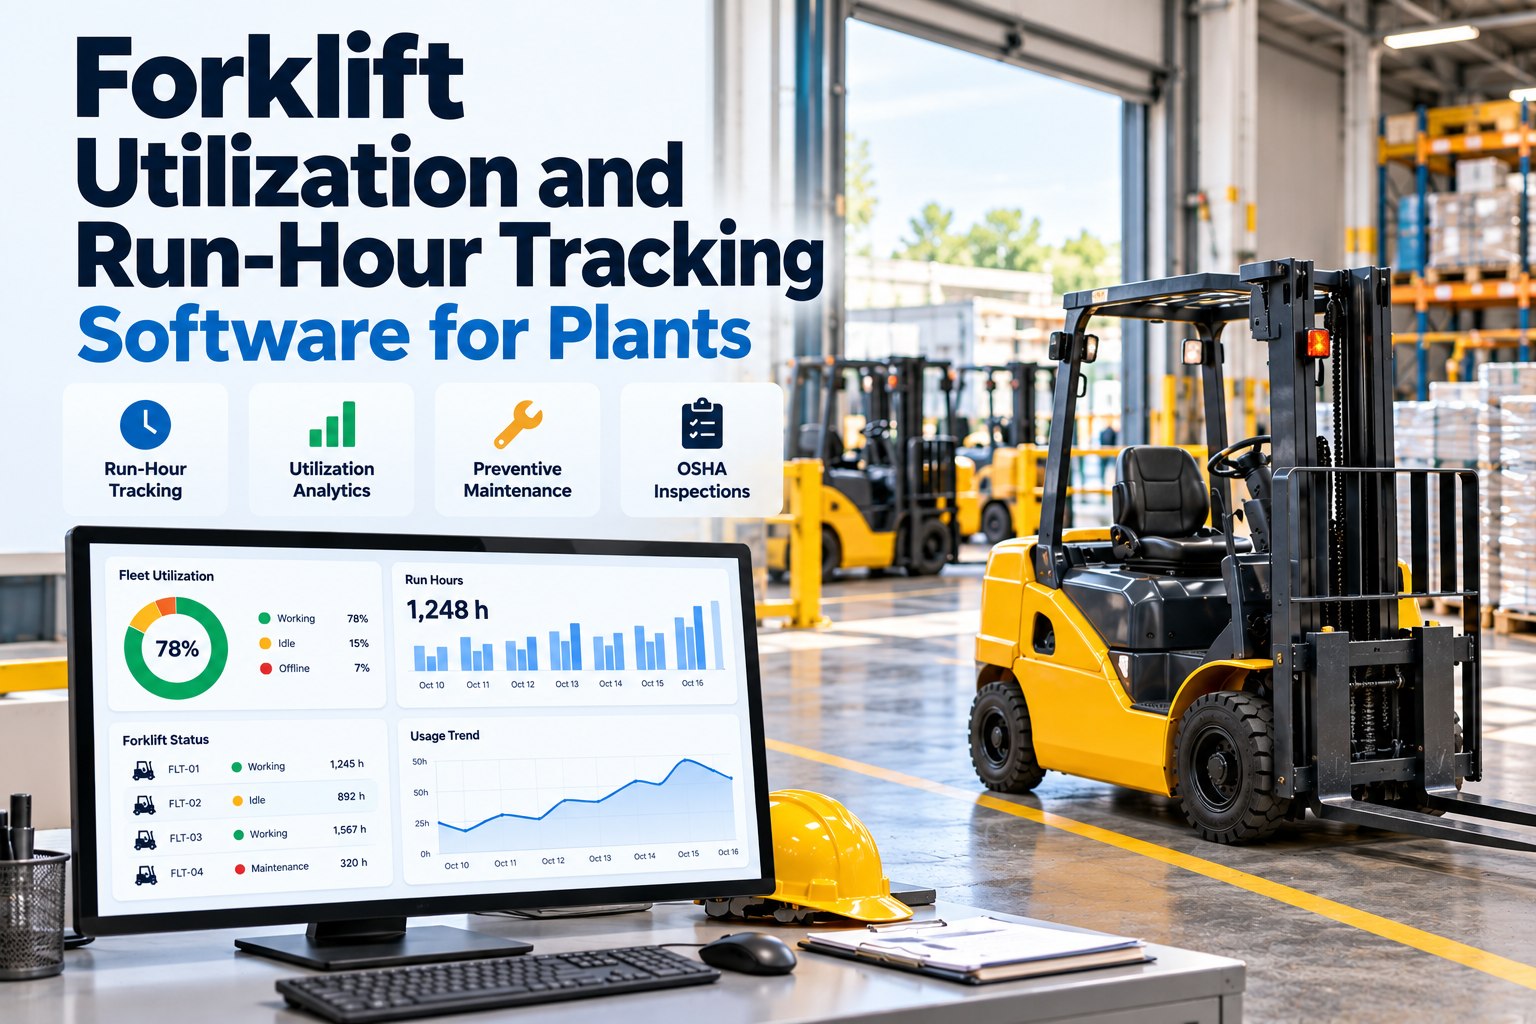
Forklift utilization software answers one deceptively simple question with hard data: which trucks are earning their keep. It does this by capturing engine hours, idle time, movement, and operator usage for every asset, then rolling that telemetry into utilization metrics. Instead of assuming a 40-truck fleet needs 40 trucks, the software shows that peak concurrent usage never exceeds 31. That single insight frees 9 trucks for redeployment, resale, or retirement. The best platforms go further, layering cost data on top of usage so managers see not just which trucks are idle, but which idle trucks are also the most expensive to own.
The Core Metrics That Matter in 2026
When comparing utilization software, the metrics it tracks determine its value. Raw engine hours alone are not enough. Modern platforms track utilization rate, which measures actual operating hours against available shift hours. They track peak concurrency, showing the maximum number of trucks ever used simultaneously, which is the true fleet size requirement. They track idle versus working time, separating trucks that are keyed on but not moving. And they track utilization by zone and department, exposing imbalances across the plant. Software that misses any of these dimensions leaves blind spots that cost money.
Why Utilization Data Drives Fleet Decisions
Utilization data is the foundation of every smart fleet decision. Replacement planning, rental decisions, new purchase requests, and battery infrastructure sizing all depend on knowing how hard the current fleet actually works. A plant that sees 45 percent utilization knows it can absorb growth without buying. A plant that sees 85 percent utilization in one zone knows exactly where to add capacity. Without this data, every capital request is a negotiation based on opinions. With it, decisions become math. To start making data-driven fleet decisions, you can sign up for FleetRabbit to track utilization, or book a demo to see the platform in action.
FleetRabbit tracks engine hours, idle time, and peak concurrency across your whole plant fleet, exposing idle and ghost forklifts instantly. Stop guessing at fleet size and start right-sizing with data. Start your free trial today.
Comparing the Top Utilization Software Options
Not all utilization platforms are built for manufacturing plants. Some are designed for warehouses with uniform fleets, others for outdoor trucking. When comparing the leading options for 2026, manufacturing managers should evaluate each platform against the specific demands of a plant environment: mixed equipment classes, multiple buildings, departmental cost accountability, and maintenance integration. The table below breaks down the comparison criteria that separate genuine plant-grade utilization software from generic alternatives.
| Comparison Criteria | Generic Telematics | Basic Utilization Apps | FleetRabbit 2026 |
|---|---|---|---|
| Utilization Metrics | Engine hours only | Basic idle vs active split | Full rate, concurrency, zone, and department views |
| Equipment Coverage | Powered trucks only | Limited asset classes | Forklifts, pallet jacks, and auxiliary equipment |
| Multi-Building Support | Outdoor GPS only | Single-site focus | Indoor positioning across every building |
| Maintenance Link | Separate system | Manual entry required | Utilization drives PM schedules automatically |
| Cost Integration | No cost data | Usage without spend | Cost per hour tied to every asset |
| Right-Sizing Reports | Raw data exports | Simple utilization charts | Actionable fleet size recommendations |
How to Evaluate Software for Your Plant
Evaluating utilization software starts with your plant's specific blind spots. If trucks disappear between buildings, prioritize indoor positioning. If the maintenance budget feels bloated, prioritize cost-per-hour integration. If capital requests keep getting approved without evidence, prioritize right-sizing reports that calculate true peak demand. The best approach is a structured pilot: track utilization on a subset of the fleet for 60 days, compare the data against existing assumptions, and let the numbers reveal where the full deployment will pay back fastest.
Running a 60-Day Utilization Pilot
A 60-day pilot is the fastest way to prove value before committing. Select 10 to 15 trucks across different departments, deploy tracking, and capture two full months of usage including at least one production surge. At the end, compare peak concurrency against fleet size. Most plants discover their actual concurrent need is 20 to 30 percent lower than their asset count, which immediately justifies the software and identifies redeployment opportunities. The pilot also surfaces data quality issues, like trucks that never get keyed on properly, while the stakes are still low.
Turning Utilization Data Into Savings
Turning utilization data into savings requires acting on three opportunities. First, redeploy idle trucks from low-utilization zones to departments requesting new purchases, converting a capital request into a zero-cost transfer. Second, retire or sell chronic low-utilization, high-cost assets, eliminating their maintenance and insurance burden. Third, use peak concurrency data to renegotiate rental contracts, keeping only the surge capacity the data actually justifies. Plants that execute these three moves typically recover their software investment within the first quarter. To run your own utilization analysis, you can sign up for FleetRabbit to track your fleet, or book a demo to see the platform in action.
Why FleetRabbit Leads for Manufacturing Plants
FleetRabbit stands out in the 2026 utilization software landscape because it was built for the realities of manufacturing rather than adapted from generic trucking tools. Our platform tracks utilization across every equipment class, from sit-down forklifts to electric pallet jacks, and works inside steel buildings where GPS fails. Utilization data flows directly into maintenance scheduling, so trucks that work harder get serviced sooner automatically. And every usage hour ties to cost data, giving plant executives the cost-per-hour and department-level views they need for budget decisions. The result is a single system that answers both how hard the fleet works and what it costs to keep it working.
From Data to Right-Sized Fleet
FleetRabbit converts utilization telemetry into concrete right-sizing recommendations. The platform analyzes 90 days of history, calculates peak concurrency by zone and shift, and flags assets whose utilization falls below thresholds you define. Instead of handing managers a spreadsheet, it hands them a decision: these three trucks can be retired, these two should move to shipping, and this rental contract exceeds your actual surge need. That translation from data to action is what separates utilization software that gets watched from utilization software that gets used.
Executive-Ready Utilization Reporting
Executive-ready reporting ensures utilization insights reach the people controlling capital. FleetRabbit's executive dashboard summarizes fleet utilization rate, idle asset count, cost per hour by department, and projected savings from right-sizing in a single view. When a department requests two new forklifts, the plant manager can open the dashboard, show their current 38 percent utilization, and redirect the conversation toward efficiency. This transparency transforms capital planning from advocacy into analysis, protecting budgets and rebuilding trust between operations and finance.
Key Takeaways for Choosing Software
Choosing the right forklift fleet utilization software in 2026 comes down to matching capabilities to your plant's blind spots. Generic telematics that only count engine hours will not expose ghost assets hiding between buildings. Basic utilization apps without cost integration will show idle trucks but not which idle trucks are draining the budget. The platforms that deliver real ROI track full utilization metrics, cover every equipment class, work indoors, and connect usage data to maintenance and cost.
FleetRabbit delivers all of these capabilities in a single platform purpose-built for manufacturing. Plants using it typically cut material handling costs by 15 to 25 percent by eliminating over-purchasing, reducing rental spend, and retiring high-cost low-use assets. The software pays for itself the first time it prevents a single unnecessary 40,000 dollar forklift purchase.
The path forward is clear. Ask yourself how many of your forklifts are actually running right now, and whether you could prove it with data. If the answer involves guesswork, your fleet is oversized or misallocated, and you are paying for it daily. Plant managers who adopt utilization tracking systematically protect their capital budgets and operational efficiency. You can sign up for FleetRabbit to start tracking utilization, or book a demo to see the platform in action.
Frequently Asked Questions About Utilization Software
Every idle forklift on your floor is capital sitting still, and every blind purchase compounds the waste. FleetRabbit exposes idle and ghost assets across your plant and turns utilization data into right-sizing decisions that cut costs 15 to 25 percent. Start your free trial today with no credit card required.