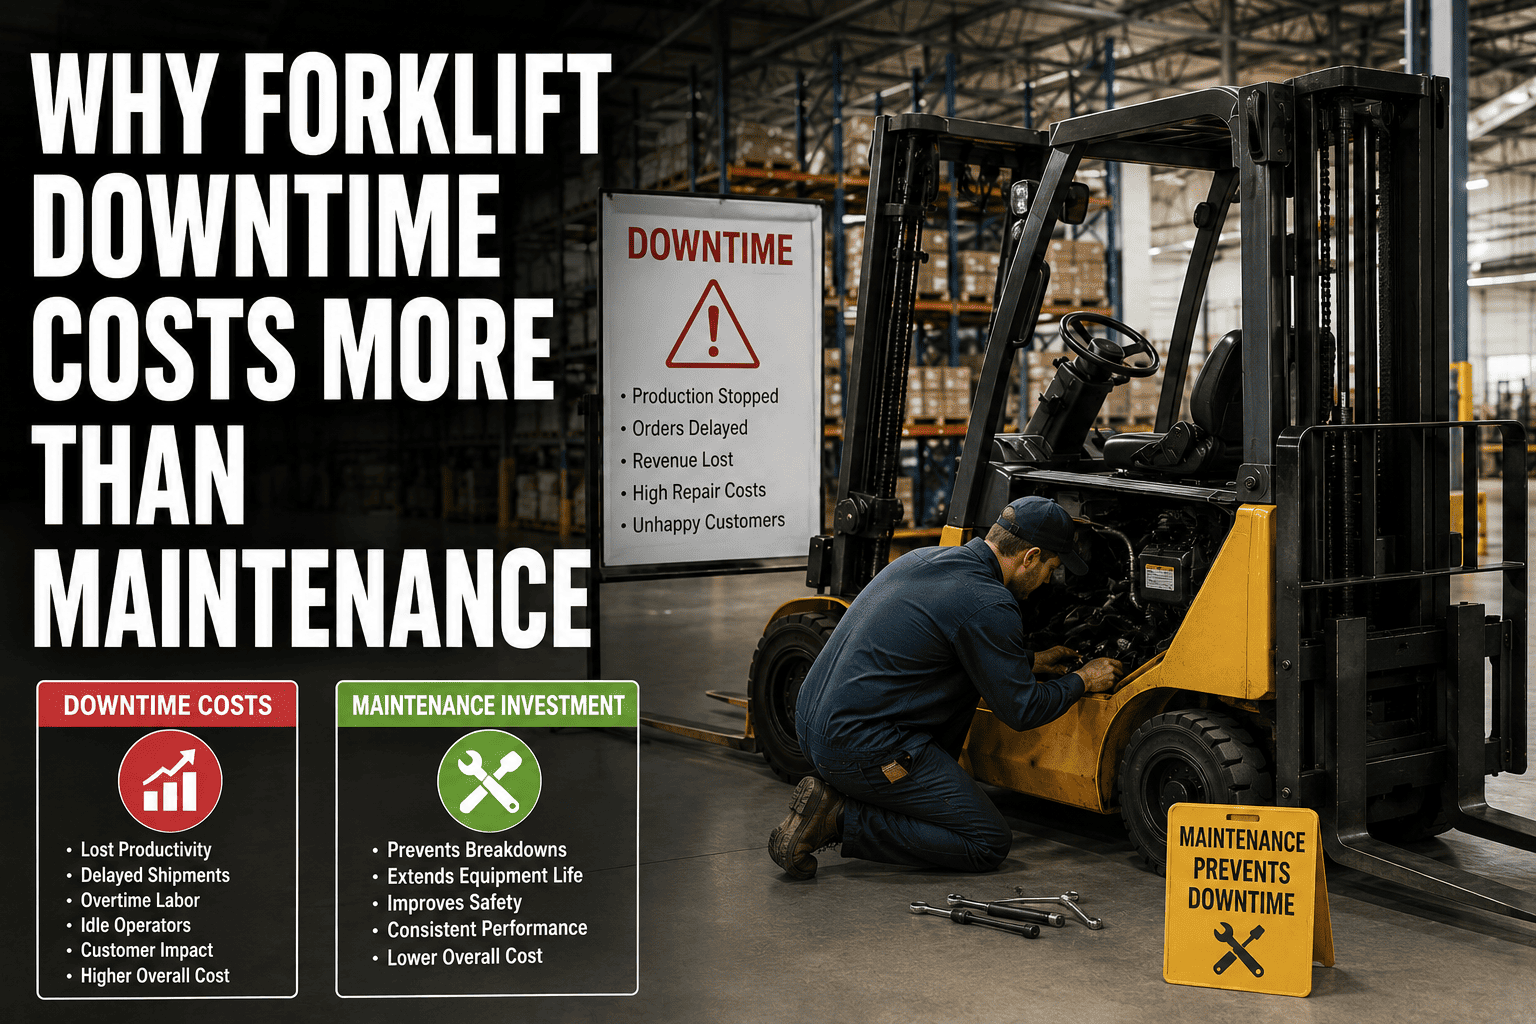
Ask a plant manager what a forklift costs and most will quote the maintenance invoice: parts, labor, maybe a service contract line item. That number is real, but it is also the smallest part of the story. When a forklift goes down mid-shift, the repair bill is just the receipt for a much bigger loss that already happened upstream, on the production line the truck was feeding. Materials stop moving, operators stand idle, and a problem that looked like a $400 part failure turns into a multi-thousand dollar production event before anyone even calls a technician.
Line stoppage in a high-throughput manufacturing plant typically costs between 2,000 and 8,000 dollars per hour, and that meter starts running the moment a forklift stalls, not when the repair invoice is written. An unplanned failure also costs 3 to 5 times more to fix than the same repair done on a planned schedule, because overtime labor and expedited parts replace normal procurement. Yet more than half of manufacturing forklift fleets still operate on a pure break-fix model.
- Replacement parts and fluids
- Technician labor hours
- Scheduled service contract fees
- Production line stoppage per hour
- Idle operators still on the clock
- Expedited parts and overtime labor
- Missed shipments and SLA penalties
The Math Manufacturers Get Wrong
The gap between those two numbers is exactly why forklift downtime is systematically underestimated. Finance tracks the maintenance line item because it shows up on an invoice. Nobody sends an invoice for the hour the production line waited, the pallet that didn't reach the packing station, or the operator who stood next to a dead truck for forty minutes. Those costs are just as real, they simply don't have a paper trail, which means they rarely make it into the budget conversation until the pattern becomes impossible to ignore.
This is not a rounding error. A facility running four unplanned forklift breakdowns a month, each stalling a line for even 90 minutes, is looking at tens of thousands of dollars in production losses annually that never appear next to "forklift maintenance" in the ledger. Once secondary effects like rush shipping and customer penalty clauses are added in, the true figure is often three times higher than what a plant initially estimates.
FleetRabbit tracks downtime against the production line it affects, not just the repair ticket. Sign up free and see your fleet's true downtime cost within the first week.
How One Broken Forklift Cascades Through the Plant
A single unplanned breakdown rarely stays contained to the truck itself. It moves through the plant in a predictable sequence, and each stage adds cost that the original repair estimate never captured.
The Forklift Stalls Mid-Move
A pallet that should have reached the line is now sitting exactly where the breakdown happened, often blocking an aisle other trucks need.
The Production Line Runs Out of Material
Without a steady supply of components or raw material, the line slows or stops completely, and every worker on it is still being paid to wait.
A Technician Drops Scheduled Work
Maintenance pulls a technician off planned preventive tasks to respond to the emergency, which pushes that scheduled work further behind.
Parts Ship at Premium Rates
If the part isn't in inventory, it arrives via expedited freight at a markup, instead of through normal procurement channels.
The Shipment Slips
Lost hours push the order past its ship date, risking a customer penalty clause or, worse, a customer who starts looking at alternative suppliers.
Why This Cascade Rarely Shows Up in Reports
Most maintenance software logs the repair: what broke, what part was used, how long the technician worked. Very few systems connect that repair to the production line it fed or the shipment it delayed. Without that link, the cascade above is invisible in every report except the one that matters most to leadership: quarterly margin.
Planned Maintenance vs Unplanned Failure, Side by Side
| Factor | Planned Maintenance | Unplanned Failure |
|---|---|---|
| Labor Rate | Standard hours, scheduled technician | Overtime or emergency callout rates |
| Parts Sourcing | Normal procurement, best pricing | Expedited shipping at premium cost |
| Production Impact | Zero, work is scheduled around it | Line stoppage of $2,000 to $8,000 per hour |
| Repair Duration | Hours, with parts on hand | Often days, waiting on parts or a technician slot |
| Total Cost Multiplier | Baseline | 3 to 5 times the planned cost |
Why the Break-Fix Model Still Dominates
Given how expensive unplanned downtime is, it seems obvious that every fleet should run on a predictive schedule. In practice, a majority of manufacturing forklift fleets still operate reactively, fixing trucks only after they fail. The reason usually isn't a lack of awareness. It's a lack of visibility. Without hour meters, usage data, and condition monitoring feeding into a single dashboard, maintenance teams simply cannot see a failure coming, so they wait for the truck to tell them by breaking down.
The Visibility Gap Is the Real Problem
A forklift running two shifts a day wears differently than one running a single shift, yet both are often serviced on the same calendar-based schedule. That mismatch means some trucks get serviced too early, wasting labor, while others fail before their next scheduled check. Usage-based, condition-triggered maintenance closes that gap, but only if the data is actually being collected and acted on.
What Closing the Gap Looks Like
Hour-based service triggers instead of fixed calendar dates, automatic alerts when a truck's usage pattern deviates from normal, and a maintenance queue that prioritizes trucks by actual risk rather than by which one broke down loudest.
FleetRabbit tracks real usage hours and condition signals across every truck, flagging risk before it becomes a line stoppage. Book a demo to see your fleet's risk profile mapped out.
Numbers Worth Watching Every Month
A short list of metrics tells you whether your maintenance model is actually protecting production or quietly draining it. Mean time between failures shows whether trucks are lasting longer between breakdowns as data accumulates. Mean time to repair, ideally under five hours industry-wide, shows how fast your team can respond when something does go wrong. The ratio of planned to unplanned repairs is the clearest signal of all: fleets moving that ratio in favor of planned work consistently report fewer surprise line stoppages and a shrinking emergency parts bill. Finally, cost per operating hour, tracked over time, reveals whether downtime is trending toward control or toward crisis, well before it shows up as a bad quarter.
Key Takeaways
The maintenance invoice was never the real cost of a broken forklift. It is the visible fraction of a much larger number that includes stopped production, idle labor, expedited parts, and the shipments that slip because of it. Manufacturers that keep budgeting around the invoice alone will keep underestimating downtime by a wide margin, often by a factor of three or more once every cost is counted.
Closing that gap doesn't require replacing the fleet. It requires visibility into how each truck is actually being used, so maintenance happens based on real risk instead of a fixed calendar or a breakdown. That shift, from reactive to predictive, is consistently the highest-leverage change a manufacturing plant can make to protect both its maintenance budget and its production schedule.
FleetRabbit connects forklift health data to the production lines they serve, so you see the real cost of downtime before it becomes next quarter's bad surprise.







