The check engine light has been flickering for weeks. The driver complains about the ride quality. The maintenance supervisor is recommending a transmission rebuild — for the second time in 18 months. And somewhere in the finance department, someone is calculating how much this truck is actually costing the company. The answer, more often than not, is far more than anyone realizes. Aging fleet vehicles are like icebergs: the visible maintenance costs are just the tip. Beneath the surface lie hidden expenses that drain profitability, compromise safety, and undermine operational efficiency. Understanding these costs is the first step toward making smarter replacement decisions.
The Hidden Costs of Running Aging Fleet Vehicles Past Their Useful Life
The Maintenance Cost Trap
The most visible cost of aging vehicles is maintenance, but its true scale is often underestimated. A 2024 Teletrac Navman survey of fleet managers found that 86% of respondents reported experiencing unexpected increases in maintenance costs over the previous two years. These increases are not linear — they accelerate sharply as vehicles age beyond the 5-year mark.
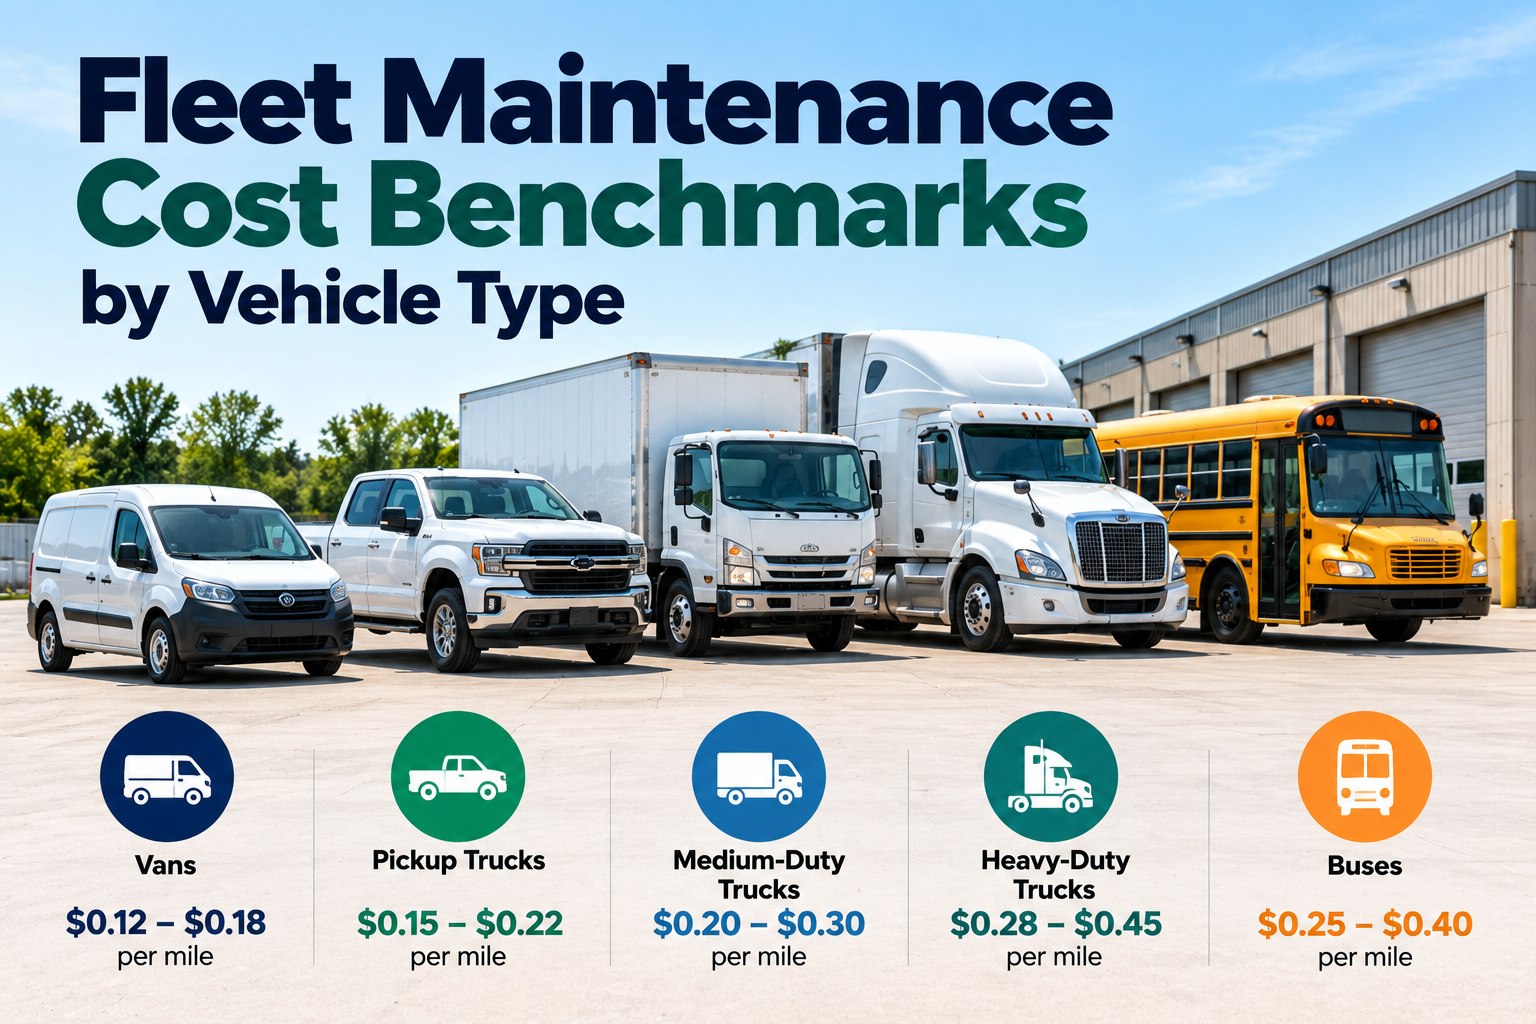
For light-duty pickup trucks, maintenance and repair costs per mile typically remain below $0.05 for the first 3 years, then climb to approximately $0.08 in year 5, and exceed $0.10 by year 8. For heavy-duty Class 8 trucks, the pattern is similar but more pronounced. The cost of parts and labor grows exponentially as major components — transmissions, differentials, turbochargers, and aftertreatment systems — reach the end of their service life. A single major repair, such as an in-frame engine overhaul, can cost $15,000-$25,000 and consume days of downtime.
What makes this particularly insidious is the cumulative effect. An older truck that needs multiple repairs in a year — a water pump here, an alternator there, a transmission rebuild — quickly accumulates costs that exceed a new truck payment. And each repair carries the risk of discovering additional problems, turning a scheduled job into an unexpected expense. To track your fleet's true maintenance costs and identify vehicles approaching the replacement tipping point, sign up with FleetRabbit and access our lifecycle analytics tools.
The Math of Replacement: A 10-year-old Class 8 truck with 800,000 miles typically requires $0.30-$0.45 per mile in maintenance, compared to $0.10-$0.15 for a 3-year-old truck. Over 100,000 miles, that's a $15,000-$30,000 difference.
Fuel Consumption: The Silent Profit Killer
Aging vehicles consume more fuel — often much more. A 15-25% increase in fuel consumption is common for vehicles beyond their optimal lifecycle, and the reasons are multiple. Engine efficiency degrades gradually over time due to normal wear on piston rings, cylinder walls, and fuel injectors. The aerodynamic profile of a vehicle changes as components shift, seals wear, and panels deform. Tire rolling resistance increases as tread wears and alignments drift.
Perhaps most significantly, engine oil and coolant degradation accelerates wear, reducing thermal efficiency and increasing friction. The result is a truck that burns more fuel to deliver the same performance. For a Class 8 truck covering 120,000 miles annually, a 15% fuel efficiency loss translates to approximately 1,800 extra gallons of diesel per year — at $4.00/gallon, that's $7,200 in additional annual fuel costs. Over a three-year period, that single vehicle has cost the fleet over $20,000 in unnecessary fuel expenses.
These efficiency losses compound with other costs. An older truck that is less fuel efficient is also producing more emissions, which can impact compliance scores and create regulatory exposure. In jurisdictions with strict emissions standards, the risk of out-of-service violations increases with vehicle age. To monitor fuel efficiency trends across your fleet and identify underperforming vehicles, book a demo with FleetRabbit and explore our fuel analytics dashboards.
The Downtime Multiplier
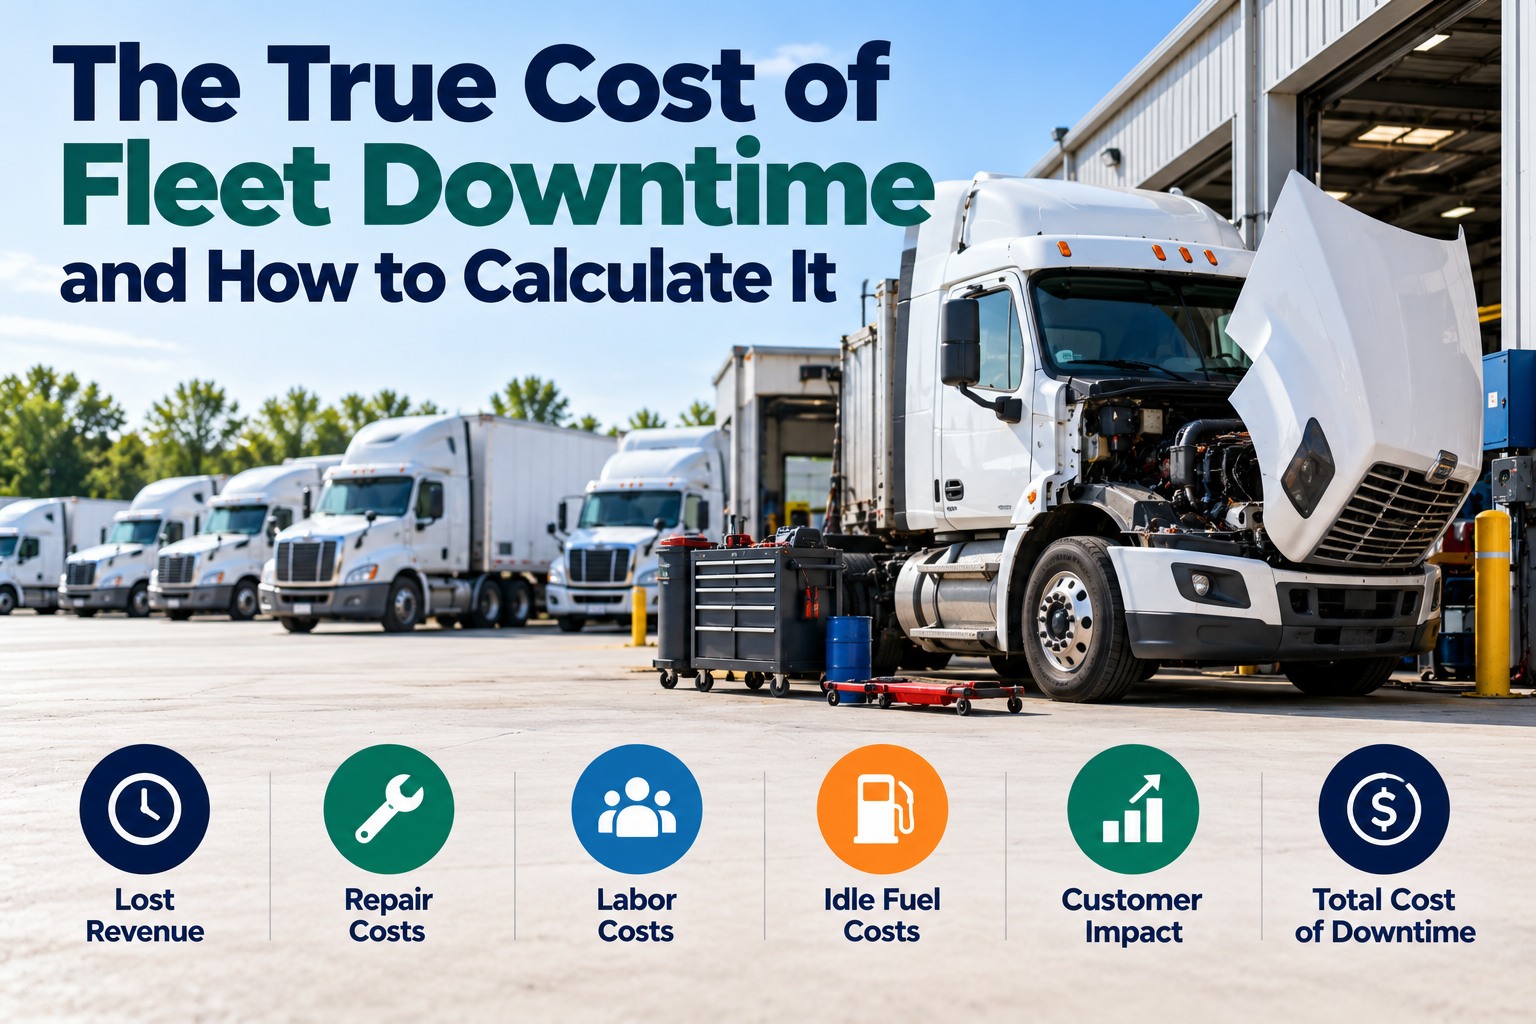
Perhaps the most underappreciated cost of aging vehicles is downtime. When an older truck breaks down, it's not just the repair cost that matters — it's the lost revenue. A Class 8 truck generates $200-$500 per day in revenue, depending on the operation. A breakdown that takes two days to repair means $400-$1,000 in lost revenue, plus the cost of towing, the administrative time to manage the repair, and the potential overtime for the maintenance team.
But the ripple effects are even larger. A breakdown can cause cascading delays across the entire operation. A truck that doesn't arrive on time means a missed pickup or delivery. A missed delivery can trigger penalties, strain customer relationships, and potentially lose future business. For just-in-time logistics operations, the impact can be measured in contract dollars rather than repair estimates.
Industry data shows that vehicles older than 10 years have twice the frequency of unplanned downtime compared to vehicles under 5 years. And the average duration of downtime is also longer, as parts availability for older models is less certain, and the complexity of repairs often increases. To understand the true downtime cost of your aging vehicles and make data-driven replacement decisions, sign up with FleetRabbit and access our downtime analysis tools.
Vehicles over 10 years old break down twice as often
Older vehicles take longer to diagnose and repair
Direct and indirect costs of a single unplanned downtime event
The Resale Value Cliff
Every fleet manager knows that vehicles depreciate, but the pattern of depreciation is not linear. Used truck values follow a steep curve: the largest value drop occurs in the first two years, then a more gradual decline until approximately year 6, after which values fall off a cliff. A 4-year-old truck with 400,000 miles might sell for 50-60% of its original price. A 7-year-old truck with 700,000 miles might bring only 20-30%.
This depreciation cliff is driven by buyer preferences. Most used truck buyers are looking for vehicles with at least two years of productive life remaining. Once a vehicle exceeds 700,000 miles or 7 years, the pool of potential buyers shrinks dramatically. The buyers who remain are typically smaller operators with limited capital, and they expect steep discounts to compensate for the higher risk of major repairs.
The financial impact is twofold: the fleet receives less value when it finally sells the vehicle, and the retained value of the aging vehicle declines faster than the cost of replacing it. In many cases, the accelerated depreciation of an aging vehicle exceeds the cost of a new truck payment. To maximize resale value and optimize replacement timing, fleet managers should use lifecycle analysis tools. Book a demo with FleetRabbit to see how our platform helps you time replacements for maximum value recovery.
Safety and Compliance Exposure
Aging vehicles present increased safety risks that carry significant financial and reputational costs. A comprehensive safety analysis of 3.5 million commercial vehicles found that new trucks are almost 40% less likely to be involved in a crash than the oldest models. Specifically, vehicles newer than 12 months had the lowest crash rate, while vehicles over 10 years old had the highest. Safety-related defects are also more prevalent in older vehicles, with one study finding that 29% of vehicles over 6 years old had safety-related out-of-service defects, compared to 13% of newer vehicles.
The compliance risk is equally significant. Aging vehicles are more likely to fail annual inspections, require expensive re-inspections, and accumulate violations that can impact CSA scores. A poor CSA score can affect insurance premiums, contract eligibility, and the company's ability to attract and retain drivers. In the current regulatory environment, where roadside inspections are increasing and enforcement is becoming more stringent, the compliance burden of aging vehicles is a growing liability.
For fleets operating across state lines or in jurisdictions with strict emissions standards, aging vehicles also present environmental compliance risks. Failure of emissions control systems can result in substantial fines and reputational damage. To monitor safety and compliance risk across your fleet, sign up with FleetRabbit and access our compliance monitoring tools.
Driver Retention and Satisfaction
In a tight driver market, the quality of equipment is a critical factor in driver retention. A TIDA survey found that old and unreliable equipment is one of the top reasons drivers leave their current employer. Drivers want modern, comfortable, well-maintained trucks. They don't want to explain to dispatch why they're broken down again, or spend hours in a repair shop waiting for parts, or deal with a truck that rides poorly and handles unpredictably.
This is not just a matter of comfort — it's a matter of productivity. A driver who is confident in their equipment is more productive, more engaged, and more likely to represent the company well to customers. A driver who is frustrated with constant breakdowns is more likely to be late, less likely to go the extra mile, and more likely to update their resume. The cost of driver turnover — recruitment, training, lost productivity — can easily exceed $10,000 per driver. For a fleet of 50 trucks, losing just 5 drivers per year to equipment-related dissatisfaction represents a $50,000 annual cost.
Many fleets have found that proactively replacing aging vehicles not only improves driver satisfaction but also attracts higher-quality drivers who are seeking stable employment with reliable equipment. This creates a positive cycle: better equipment attracts better drivers, which improves safety and productivity, which further reduces costs and improves profitability. To understand the driver retention implications of your fleet's age profile, book a demo with FleetRabbit and explore our driver engagement analytics.
FleetRabbit's lifecycle analysis platform helps you identify aging vehicles that are draining profitability and make data-driven replacement decisions.
The Replacement Decision: When to Pull the Trigger
Deciding when to replace a vehicle is one of the most consequential decisions a fleet manager makes. The optimal replacement point depends on the specific duty cycle, maintenance history, and market conditions, but some general guidelines exist. For light-duty fleets, the optimal replacement age is typically between 4 and 6 years, or 100,000 to 150,000 miles. For medium-duty trucks, the optimal point is typically 5 to 7 years, or 150,000 to 200,000 miles. For heavy-duty Class 8 trucks, the optimal replacement window is typically 6 to 8 years, or 500,000 to 700,000 miles.
Beyond these general guidelines, lifecycle analysis tools can help fleet managers make precise replacement decisions. By tracking total cost of ownership — including acquisition costs, maintenance, fuel, depreciation, downtime, and resale value — fleet managers can identify the point at which the cumulative costs of retaining a vehicle exceed the cost of replacing it. This is the vehicle's lifecycle inflection point.
Many fleet managers use a "time to replace" metric that combines age, mileage, maintenance cost history, and projected future costs. Industry benchmarks suggest that when a vehicle's annual maintenance cost exceeds 10-15% of its current market value, it's time to consider replacement. When maintenance costs exceed 20% of market value, replacement is almost certainly the financially optimal choice. To calculate these metrics for your fleet, sign up with FleetRabbit and access our lifecycle analysis module.
Frequently Asked Questions
At what age do fleet vehicles become too expensive to maintain?
The optimal replacement age varies by vehicle type and duty cycle, but general guidelines suggest 4-6 years for light-duty, 5-7 years for medium-duty, and 6-8 years for heavy-duty Class 8 trucks. Once annual maintenance costs exceed 15-20% of the vehicle's market value, replacement is usually the financially optimal choice.
How much does fuel efficiency decline as vehicles age?
Vehicles beyond their optimal lifecycle can experience 15-25% reductions in fuel efficiency due to engine wear, aerodynamic degradation, and increased rolling resistance. For a Class 8 truck covering 120,000 miles annually, a 15% efficiency loss equals approximately $7,200 in additional fuel costs per year.
How does vehicle age affect safety and crash risk?
New trucks are almost 40% less likely to be involved in a crash than the oldest models. Vehicles over 10 years old have the highest crash rates, and safety-related out-of-service defects are significantly more common in vehicles over 6 years old (29%) compared to newer vehicles (13%).
What is the optimal replacement age for Class 8 trucks?
The optimal replacement age for Class 8 trucks is typically between 6 and 8 years, or 500,000 to 700,000 miles. Beyond this point, maintenance costs accelerate, fuel efficiency declines, resale value drops significantly, and downtime frequency increases.
How does vehicle age affect driver retention?
Driver surveys consistently show that old and unreliable equipment is one of the top reasons drivers leave their current employer. Fleet operators who proactively replace aging vehicles typically attract higher-quality drivers and maintain higher retention rates.
How can I determine the right time to replace a fleet vehicle?
The most accurate approach is lifecycle analysis, which tracks total cost of ownership including acquisition, maintenance, fuel, depreciation, downtime, and resale value. When a vehicle's annual maintenance cost exceeds 15% of its current market value, replacement should be considered. FleetRabbit's lifecycle analysis tools automate this calculation for your entire fleet.
FleetRabbit's lifecycle analysis platform helps you identify hidden costs, optimize replacement timing, and maximize fleet profitability.