Most fleet budgets are built on last years numbers plus a gut-feel percentage increase. That works fine until a major component cluster fails in Q2, your repair budget is exhausted by July and you're explaining to the CFO why the fleet overspent by $340,000. The number wasn't unpredictable — it just wasn't predicted. AI-powered fleet cost prediction changes that equation entirely by replacing backward-looking budget spreadsheets with forward-looking models built from live vehicle data, historical maintenance patterns, and real-time wear indicators. The result isn't a better guess. It's a defensible, data-driven forecast that lets finance plan accurately and operations stop getting surprised. See FleetRabbit's cost prediction engine in action — book a free 30-min demo →
Why Traditional Fleet Budget Forecasting Fails
The standard fleet budget process works like this: take last year's maintenance spend, adjust upward by 5–10% for inflation and aging vehicles, distribute across 12 months, and present to finance. It's simple. It's defensible. And it's consistently wrong in ways that matter — because it treats past average spending as a predictor of future vehicle-specific costs.
What AI Fleet Cost Prediction Actually Models
The phrase "AI cost prediction" sounds abstract. The mechanics are straightforward. FleetRabbit's prediction engine processes five data streams simultaneously to produce vehicle-level cost forecasts that get more accurate over time as the model learns your fleet's specific patterns.
Engine hours, mileage, brake event frequency, idle time, fuel consumption anomalies, and fault code patterns are processed continuously. The model identifies vehicles where current wear patterns are tracking ahead of schedule — a vehicle whose brake wear rate is running 30% above baseline for its class isn't generating a fault code yet, but the cost prediction engine flags it as a near-term replacement cost. This is the interval between "nothing wrong" and "emergency repair" where intervention is cheap and effective.
Every work order closed in FleetRabbit accumulates into a per-vehicle cost history — parts cost, labour hours, frequency of specific repair types, and intervals between same-component repairs. Vehicles that have had the same component replaced twice in 18 months carry a different cost probability than vehicles with clean histories. The model weights this vehicle-specific history more heavily than fleet averages, because the pattern of this vehicle is a stronger predictor of its next cost than the average pattern of similar vehicles.
Every component in a commercial vehicle has a statistical lifecycle curve — the probability distribution of when it will need replacement as a function of hours, cycles, and conditions. FleetRabbit combines OEM-published lifecycle data with real-world performance data from the fleet to calibrate these curves for your specific operating conditions. A transit van running urban stop-start routes wears its brakes on a completely different curve than the same model doing motorway logistics. The model learns the difference.
Cost predictions need to account for what things actually cost, not what they cost 18 months ago when the fleet's maintenance records were last audited. FleetRabbit integrates current parts pricing from your preferred suppliers and uses current market labour rates for your region. When the model predicts a transmission service for a specific vehicle in Q3, the cost estimate reflects what that service will actually cost Q3 — not historical averages that may be 15–20% below current pricing due to parts inflation.
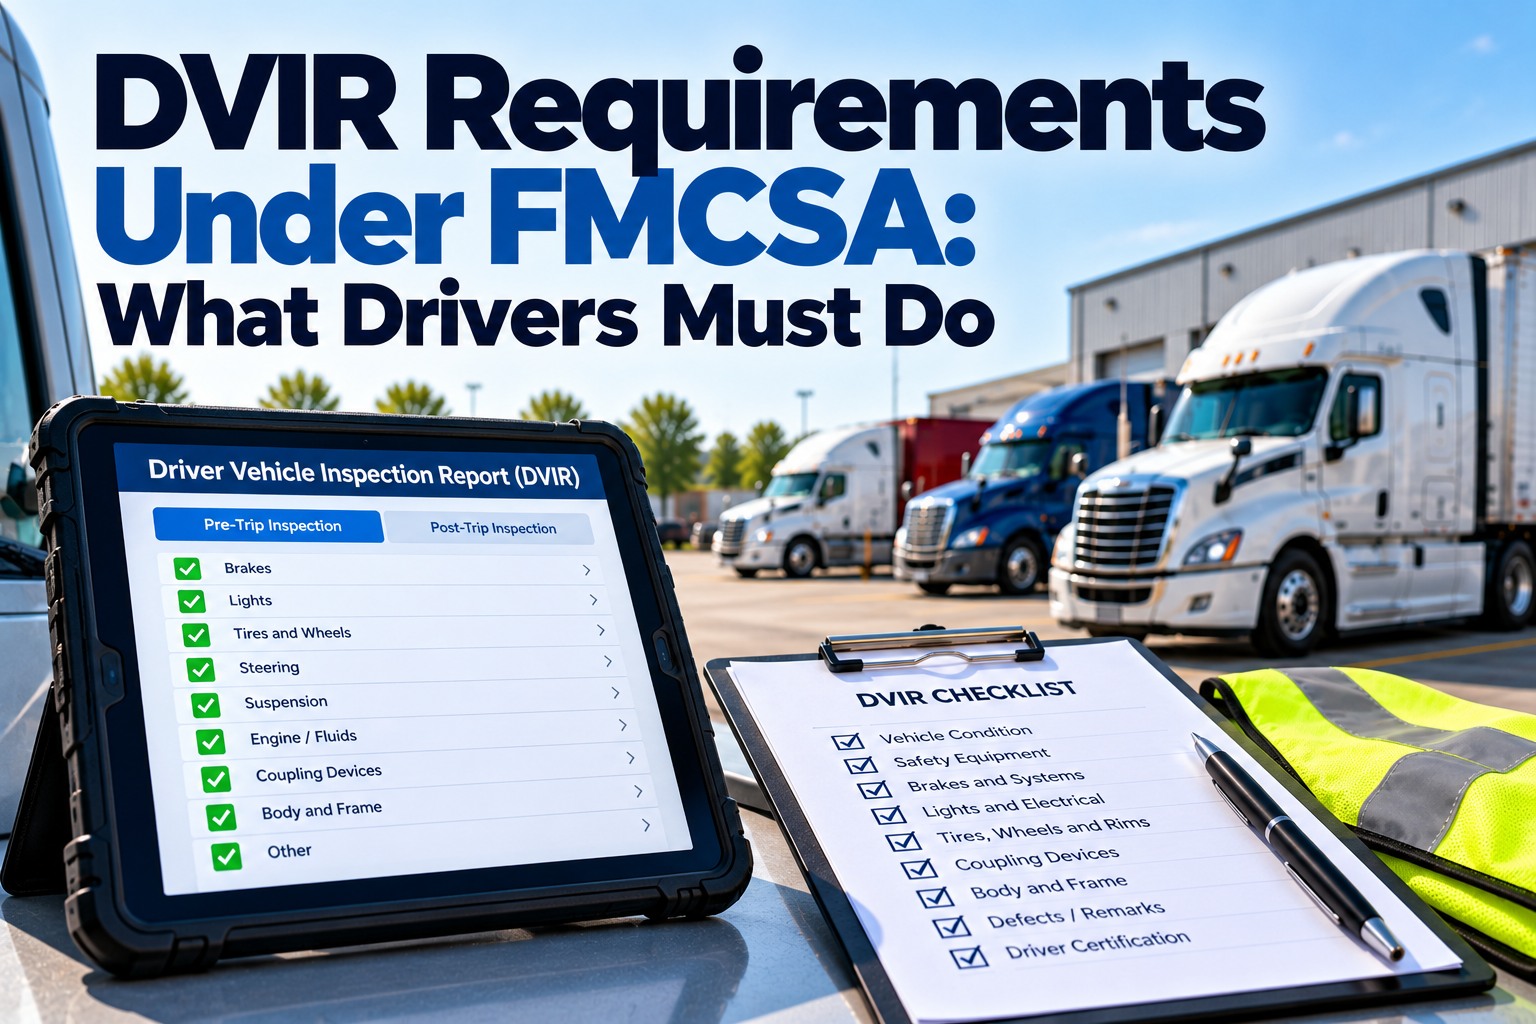
Every defect flagged in a digital DVIR inspection is a data point in the cost prediction model. A vehicle that generates more defects per inspection cycle than fleet average is showing a maintenance cost signal weeks before any scheduled service interval fires. The inspection defect rate is the earliest-available leading indicator in the dataset — and it's only available as a structured data input in fleets running digital rather than paper-based inspections.
Want to see cost prediction running on your actual fleet data? Start your free FleetRabbit trial — cost forecasting activates automatically as your fleet data accumulates →
The Replace vs. Repair Decision — Where the Biggest Savings Are
The most financially consequential fleet decision most operations make poorly is the replace-vs-repair call on aging vehicles. It's made poorly not because fleet managers lack judgment, but because the data required to make it well — total lifecycle cost projection, repair cost trajectory, utilisation impact of ongoing downtime — is never assembled in one place before the decision deadline arrives.
30 / 60 / 90-Day Budget Forecast Dashboard
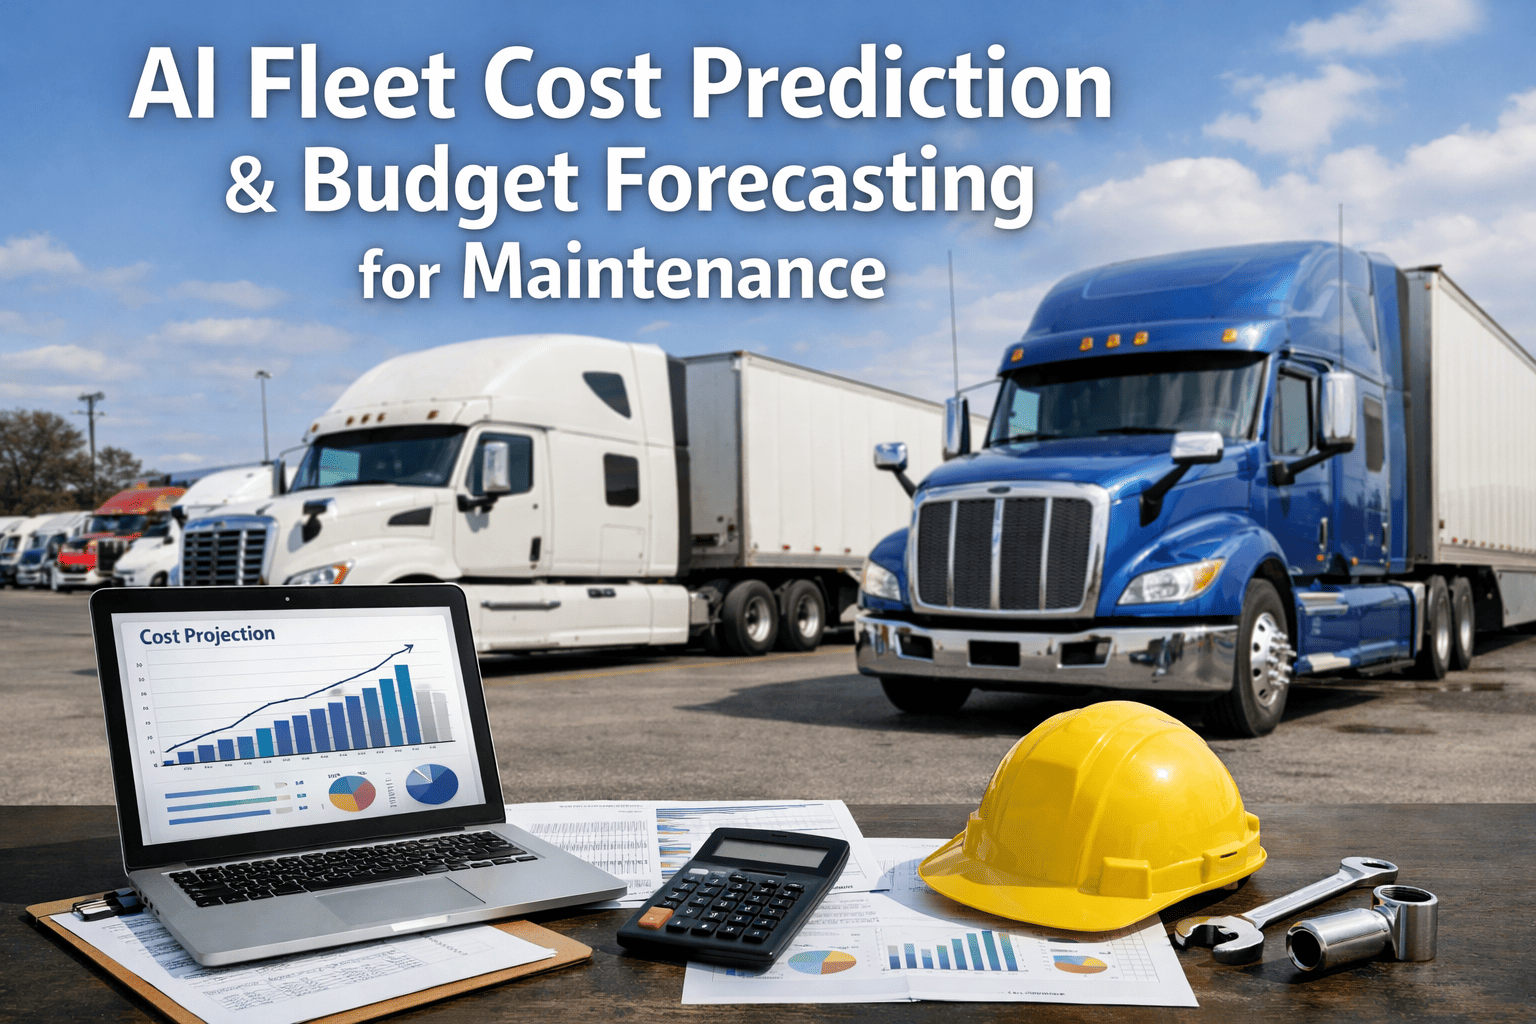
The practical output of AI fleet cost prediction isn't an academic model — it's a rolling budget forecast that fleet managers can show to finance, use to plan workshop scheduling, and update monthly as new vehicle data flows in. Here is what the FleetRabbit cost forecast dashboard surfaces.
How Cost Prediction Improves Fleet Budget Accuracy Over Time
The first month of AI cost prediction is useful. The sixth month is transformative. That's because the model's accuracy improves continuously as it accumulates vehicle-specific data — each work order closed, each inspection completed, each fault code resolved adds a calibration point to the vehicle's cost profile.
What Changes When Your Fleet Budget Is Predictive
When fleet managers consistently present 90-day cost forecasts that land within 10–15% of actual spend, finance teams shift their perception of fleet from "high-variance cost centre" to "plannable operational expense." This changes budget allocation conversations, capital planning discussions, and the credibility of replacement cycle proposals.
The predictive model identifies vehicles approaching high-cost repair thresholds weeks before they fail. Scheduling those interventions at planned-service cost — not emergency rates — reduces unplanned repair spend by 20–30% within six months. Each avoided emergency breakdown also avoids the associated downtime, driver idle cost, and customer impact that makes emergency repairs so disproportionately expensive.
When you can see a vehicle's projected maintenance cost trajectory for the next 24 months and compare it against replacement TCO, the replace-vs-repair decision becomes a scheduled strategic review rather than a crisis-driven choice forced by a catastrophic repair bill. Fleets using predictive cost modeling consistently report that replacement cycles are extended where appropriate and accelerated where data supports it — rather than defaulting to arbitrary age or mileage thresholds.
When the maintenance forecast is reliable, workshop scheduling becomes proactive. Mechanics are scheduled to work on the right vehicles at the right time rather than dropping everything for emergency repairs. Parts are ordered in advance at standard pricing rather than urgently at premium rates. The workshop runs like a planned production operation, not a reactive triage centre. Operational efficiency improvements of 15–25% in mechanic utilisation are typical within the first year.
Ready to move your fleet budget from guesswork to data-driven forecasting? Book a free demo — we'll show you a 90-day cost forecast built from your fleet's live data →
Frequently Asked Questions
How much data does FleetRabbit need before cost predictions become reliable?+
The model begins producing useful output from the first week of live fleet data — primarily by applying OEM lifecycle curves and industry benchmarks calibrated to your vehicle types. Vehicle-specific accuracy improves significantly by months three to four as actual work order history and inspection defect patterns accumulate. Most fleets find that 90-day budget forecasts are reliable within 10–15% of actual spend by the end of month six. The accuracy improvement is continuous — the model never stops learning from incoming data. Start your free trial and begin building your fleet's cost profile today →
Can FleetRabbit model different replacement scenarios to compare TCO?+
Yes. For any vehicle flagged as approaching a financial decision threshold, FleetRabbit generates a replace-vs-repair comparison that models the projected 24–36-month cost trajectory under each scenario. The replace model factors in current market acquisition cost, expected depreciation, warranty savings, and fuel efficiency improvements. The repair model projects forward based on current wear trajectory, historical repair frequency for that vehicle, and expected component lifecycle costs. Both outputs are expressed as a total cost-per-month-of-service figure for direct comparison. Book a demo to see the replace-vs-repair model in action →
Does the cost prediction work if we don't have telematics hardware on all vehicles?+
Yes, with some accuracy trade-offs. For vehicles without connected telematics, FleetRabbit uses manual mileage inputs, work order history, and digital inspection data to build the cost profile. The prediction accuracy for non-telematics vehicles is lower — typically 15–25% less accurate at the vehicle level — but still significantly better than historical average forecasting. FleetRabbit also connects to 200+ telematics providers, so if any existing GPS hardware is installed, integration typically takes less than 24 hours and immediately improves prediction accuracy for those vehicles.
How does cost prediction differ from just setting up preventive maintenance schedules?+
PM scheduling tells you when a service is due based on a fixed interval — 10,000 miles, 3 months, 500 engine hours. Cost prediction models what that service is likely to cost, what additional work is likely to be identified when the vehicle is in for that service, and what unscheduled repairs are likely to arise from the current wear trajectory before the next scheduled interval. PM scheduling is the operational tool. Cost prediction is the financial planning tool. Both are necessary — and both run simultaneously in FleetRabbit. Start free and activate both PM scheduling and cost prediction from day one →
Can the cost forecast be exported for finance and budgeting presentations?+
Yes. FleetRabbit's cost forecast dashboard supports export in PDF and CSV formats, with fleet-level and vehicle-level breakdown views. The PDF report is formatted for finance audience presentation — showing total predicted spend by period, breakdown by cost category (scheduled PM, predicted repairs, tyre and consumables, replace-flag vehicles), confidence intervals, and comparison against current budget allocation. Most fleet managers use the monthly forecast export as their primary tool for finance reporting conversations. Book a 30-minute demo to see the finance reporting workflow →
Your Next Budget Meeting Could Open With a 90-Day Maintenance Forecast Your CFO Actually Trusts.
FleetRabbit's AI cost prediction engine processes live telematics, inspection data, work order history, and component lifecycle curves to produce rolling 30/60/90-day maintenance forecasts — at the vehicle level, not fleet averages. Budget surprises become planned interventions. Replace-vs-repair decisions become data-driven. Workshop scheduling becomes proactive. Free for up to 3 vehicles.