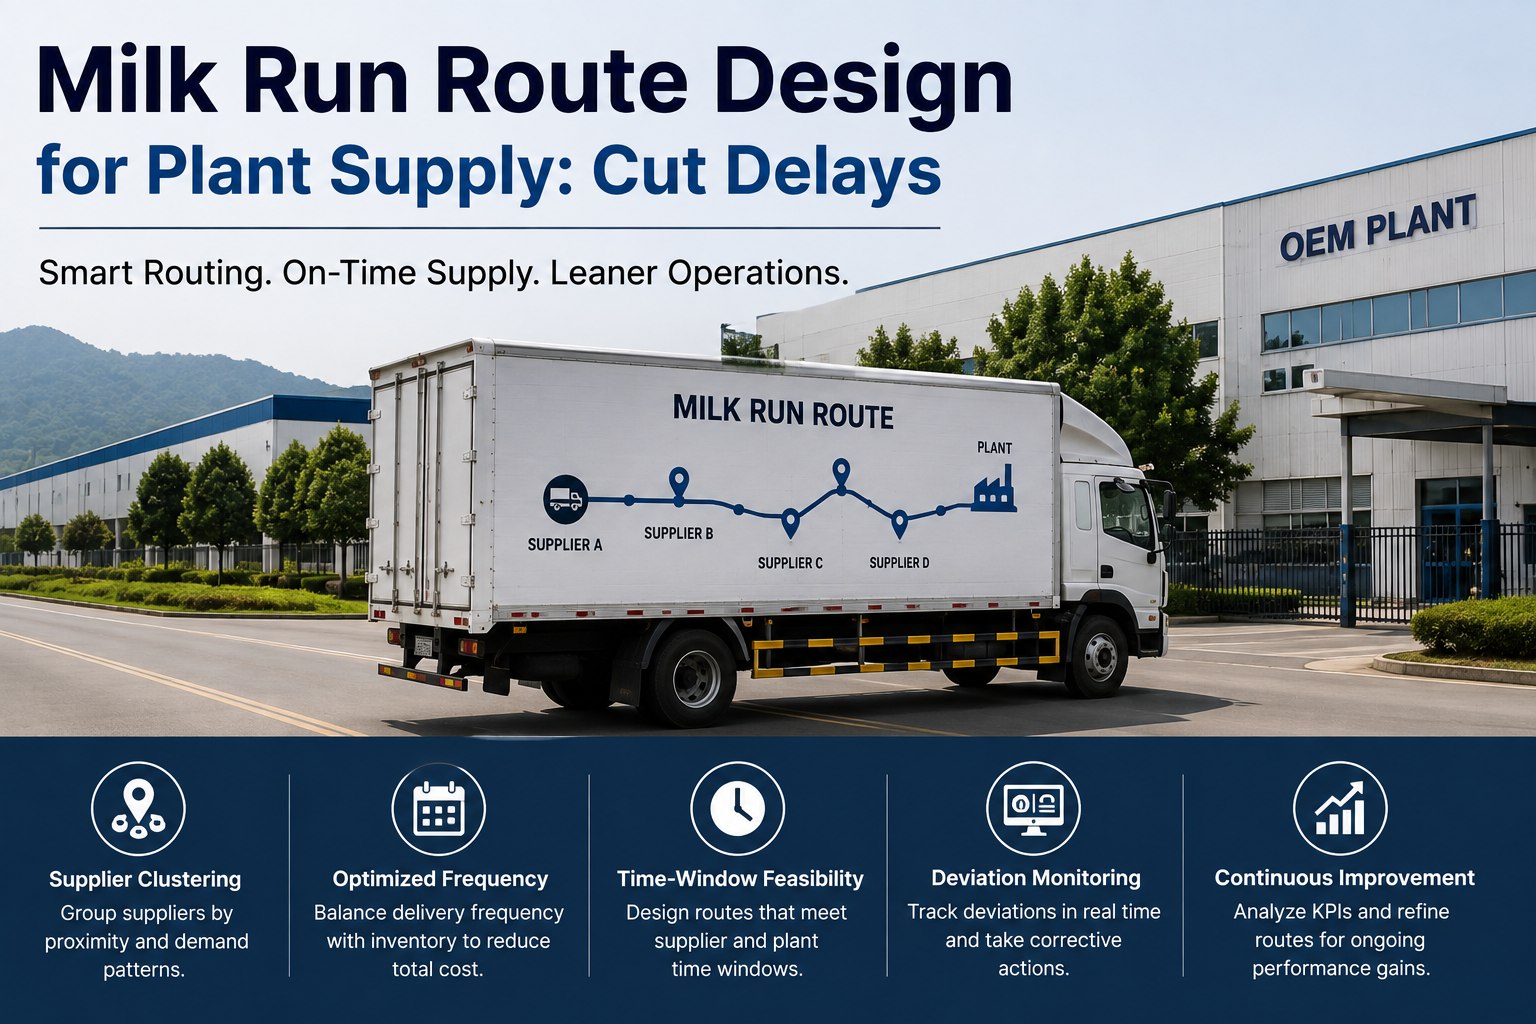
Milk run design fails in a specific and predictable way: the route is drawn on a map, it looks efficient, and it is infeasible in time. Distance is the constraint everyone models because it is the one you can see; the binding constraint is almost always the time window, because a supplier who is not ready when the truck arrives converts a well-planned loop into a driver waiting in a yard, and a route that was tight on paper now cannot make its plant delivery slot. Get the design right and the returns are substantial — where route density is high and coordination is tight, milk runs cut per-unit delivery cost by something in the order of 20 to 40%. Get it wrong and you have built a system whose interruptions produce losses measured per minute of delay on the assembly line it feeds. This covers clustering that holds up, feasibility testing against all three constraints rather than one, and the deviation monitoring that catches a route degrading before the line notices. Book an architecture review to design against your own supplier map.
ARCHITECTURE GUIDE · ROUTE DESIGN
Milk Run Route Design for Plant Supply
Clustering at a radius that actually pencils out, feasibility tested against capacity, time and drive hours together, and deviation monitoring that treats a slipping route as a production signal.
200 mi spread · drive time eats the route
30–60 mi · typically pencils out
Plant
Where Milk Runs Pay — and Where They Do Not
The economics are strong but conditional, and the conditions are worth stating plainly before any routing work begins. A milk run applied to the wrong flow is worse than the direct shipments it replaced.
Works when
Stops are geographically close and volumes are regular
Suppliers ship frequently in small quantities
Location density is strong across the candidate set
Supplier readiness is predictable rather than aspirational
Under those conditions, and with tight coordination, per-unit delivery cost typically falls by 20 to 40%.
Does not work when
Cargo is very time-sensitive and needs direct dispatch
A low-volume location sits far off the route line
Supplier readiness is erratic, so the truck waits
The cluster spans too wide a radius and drive time dominates
One unsuitable stop can make an otherwise sound route infeasible — remove it rather than absorbing it.
Clustering That Holds Up
Six rules. The first is the one that decides whether the rest matter, because a cluster drawn too wide cannot be rescued by clever sequencing.
1Keep the radius manageableRoutes covering suppliers within roughly 30 to 60 miles of each other typically work; a run spanning 200 miles burns too much drive time to justify itself.
2Cluster by demand pattern as well as geographyProximity alone produces routes where half the stops need daily collection and half need weekly. Group on both axes.
3Sequence to eliminate backtrackingA loop returning the driver to origin efficiently beats an out-and-back that repeats miles. Order the stops, do not just list them.
4Match the vehicle to the route totalA van suits a run collecting cartons or up to a few pallets; a box truck covers roughly one to twelve pallets across the full route. Sizing to the largest stop wastes the rest.
5Exclude the outlier rather than stretching for itA low-volume supplier far off the line should ship direct. Absorbing it degrades the route for every other stop on it.
6Build windows around supplier operationsPickup windows should reflect when suppliers actually have freight ready, not when it is convenient for the carrier. The schedule only works if the freight is there.
Why rule six causes the most arguments
Carriers optimise around their own shift patterns and depot geography; suppliers finish picking when their production allows. A route built on carrier convenience looks efficient and generates waiting time at every stop — which is paid for in driver hours and eventually in a missed plant slot. Where the two genuinely cannot reconcile, that supplier belongs on a different route or on direct shipment.
Feasibility Is Three Constraints, Not One
A route is feasible only if all three fit simultaneously. Most designs check capacity, assume drive time and discover the time windows in week two of operation.
Capacity
Total volume across every stop against vehicle weight, pallet count and stack height. Checked cumulatively along the route, not as a total — the truck must fit the load after stop three, not just at the end.
Breaks whenVolumes shift with the build plan and nobody re-tests
Time windows
Each supplier's readiness window and the plant's receiving slot, as fixed and cyclical constraints rather than preferences. This is where a geographically sensible route usually fails.
Breaks whenWindows are assumed rather than confirmed with each supplier
Drive and duty time
Total route duration including loading, waiting and the return leg, against the driver's available hours. Handling time at each stop is real duration and belongs in the model.
Breaks whenHandling and waiting are excluded from the route time estimate
The formal version of this is a vehicle routing problem with time windows, and the honest version of the constrained case is worth knowing: where the number of vehicles is limited, a feasible solution may be one containing unserved stops, or relaxed time windows with a lateness penalty. In other words, if your route does not fit, the model's answer is to drop a supplier or accept lateness — and if you do not choose which, the operation will choose for you.
Design step
Test all three constraints before the route is published, not after.
An architecture review takes your supplier locations, readiness windows, volumes and plant receiving slots, and identifies which candidate routes are genuinely feasible and which are feasible only on distance.
Frequency Against Inventory
Route design and delivery frequency are one decision made twice. Frequency determines how many routes you run, routes determine what frequency costs, and the two get set by different people in different quarters.
← Swipe to see all columns →
Read the third row carefully. Adding suppliers to justify an under-filled run inverts the design logic — the route now exists to be full rather than to serve consumption, and each added stop tightens time-window feasibility for every other stop already on it. Where a run is chronically under-filled, the honest fix is fewer departures, not more stops.
Deviation Monitoring
Milk run systems suffer interruptions, and in an OEM context those interruptions produce losses measured per minute of delay at the assembly line. That makes route deviation a production signal rather than a transport one, and it should be routed accordingly.
Signal
Departure outside windowEarly or late from the start point. Early matters too — a driver leaving before the countdown risks overproduction upstream and interference with another run.
Signal
Stop duration above planWaiting at a supplier who was not ready. The earliest indication that a window was agreed rather than achievable, and it compounds down the route.
Signal
Cumulative slip against the planMinutes behind at each stop, tracked forward. Tells you at stop three whether the plant slot at stop six is still reachable.
Escalate
Plant slot at riskProjected arrival outside the receiving window with a sequenced or line-critical load aboard. This is the one that goes to line feed rather than to transport.
Trend
Route drifting week over weekA route consistently finishing later than designed is a route whose feasibility assumptions have expired. Redesign rather than absorb.
Trend
Load factor fallingVolumes have moved since the route was drawn. Frequency or cluster composition needs revisiting, usually the former.
What good looks like in the data
A published VRPTW implementation across four tugger trains feeding automotive assembly stations produced 18% cost savings and a 23% reduction in travel distance, while lifting on-time deliveries from 57% to 92% and cutting late deliveries from 11% to 8%. The pattern is worth noting: the distance saving is real, and the reliability improvement is the larger operational prize.
Design it against your own supplier map
We take your supplier locations and volumes, confirmed readiness windows, plant receiving slots and current route performance, and produce clusters tested on all three feasibility constraints — with the deviation signals wired to the right owners.
The Design Sequence
Five phases. Phase one determines the quality of everything after it, and it is the phase most often replaced with an estimate.
Phase 1Feasibility and diagnosisMap current flows by quantifying shipment frequency, average shipment size, lead times and cost per stop — from actual pickup and delivery data rather than estimates.
Phase 2Candidate identificationCluster suppliers geographically and by demand pattern. The strongest candidates have frequent small shipments, strong location density and predictable readiness.
Phase 3Route construction and testingSequence for minimum backtracking, then test capacity, time windows and duty hours together. Where the route does not fit, decide explicitly whether to drop a stop or relax a window.
Phase 4Contracting and coordinationCross-functional by necessity — procurement, operations, transportation, systems and the suppliers themselves. Windows agreed bilaterally, not imposed.
Phase 5Monitor and re-cutTrack deviation and load factor from day one, and treat sustained drift as a redesign trigger rather than an execution problem.
What to Measure
Six figures. Cost per unit rather than cost per run, because cost per run improves every time a run gets less useful. Our analytics and reporting module carries them.
Cost per unit deliveredIncluding handling and waiting time. The only figure that captures the frequency trade-off honestly.
Window adherence, both endsAt supplier pickup and at plant receipt. Adherence at one end and failure at the other tells you exactly which side to fix.
Load factor per departurePer run, not averaged weekly. Averages conceal the departures that are structurally under-filled.
Waiting time per stopSupplier readiness expressed as cost. Rising values are a route redesign signal, not a driver performance one.
Cumulative slip at route endPlanned duration against actual. The single best predictor of whether the route will start missing plant slots.
Cost per stopScales with route composition rather than distance, and it is the figure that decides whether an extra supplier belongs on the run.
Frequently Asked Questions
How wide can a milk run cluster be?
Routes covering suppliers within roughly 30 to 60 miles of each other typically pencil out; a run spanning 200 miles burns too much drive time to be worth running. But radius is only half the test — cluster by demand pattern as well as geography, because a route mixing daily and weekly collection requirements will be wrong for one group whatever its shape. Where a single low-volume supplier sits far off the line, ship it direct rather than stretching the route to include it.
Why do geographically sensible routes fail?
Time windows, almost always. Distance is the constraint that gets modelled because it is visible; the binding constraint is whether each supplier has freight ready when the truck arrives and whether the loop still hits the plant's receiving slot afterwards. Build pickup windows around supplier shipping operations rather than carrier convenience — a schedule that assumes readiness produces waiting time at every stop, and waiting compounds forward through the route.
What happens when a route does not fit?
You choose, or the operation chooses for you. In the constrained routing problem with a limited number of vehicles, a feasible solution is one that may contain unserved stops or relaxed time windows carrying a lateness penalty — which is the formal way of saying that an infeasible route resolves itself by dropping a supplier or accepting lateness. Deciding which explicitly, in design, is considerably cheaper than discovering it in week two.
How much can milk runs actually save?
Where route density is high and coordination is tight, per-unit delivery cost typically falls by 20 to 40%. A published implementation across four tugger trains feeding automotive assembly stations recorded 18% cost savings with a 23% reduction in travel distance, and — more importantly for a plant — lifted on-time delivery from 57% to 92%. The reliability improvement usually outweighs the transport saving once you account for what an interruption costs at the line.
Should route deviation alerts go to transport?
Not on their own. Milk run interruptions produce monetary losses per minute of delay at the OEM assembly line, which makes a projected plant-slot miss a production signal rather than a transport one. Route the early signals — departure variance, stop overrun, cumulative slip — to logistics, and escalate a projected slot miss with a sequenced or line-critical load to line feed with the coverage impact already calculated. Same data, different recipients, chosen by consequence.
Who needs to be involved in the design?
More functions than usually are. A milk run programme requires cross-functional coordination across procurement, operations, transportation and systems, plus the suppliers themselves — because windows have to be agreed bilaterally rather than imposed, and volumes come from production planning rather than from transport. Designs produced inside logistics alone tend to be geographically excellent and operationally infeasible, for exactly the reasons above.
When should a route be redrawn?
When cumulative slip trends upward week over week, when load factor falls persistently, or when the build plan moves volumes materially. A route consistently finishing later than designed has expired assumptions rather than an execution problem, and absorbing the drift simply hides it until a plant slot is missed. Re-cut on a schedule as well as on trigger — volumes, sourcing and supplier readiness all move faster than route designs get revisited. Our
integrations overview covers the route and event data sources.
Book an Architecture Review
Feasible in Time, Not Just on the Map
Clusters drawn to a radius that works, windows built around supplier readiness, all three constraints tested together, and deviation escalated by consequence rather than by department.
Start Free Trial