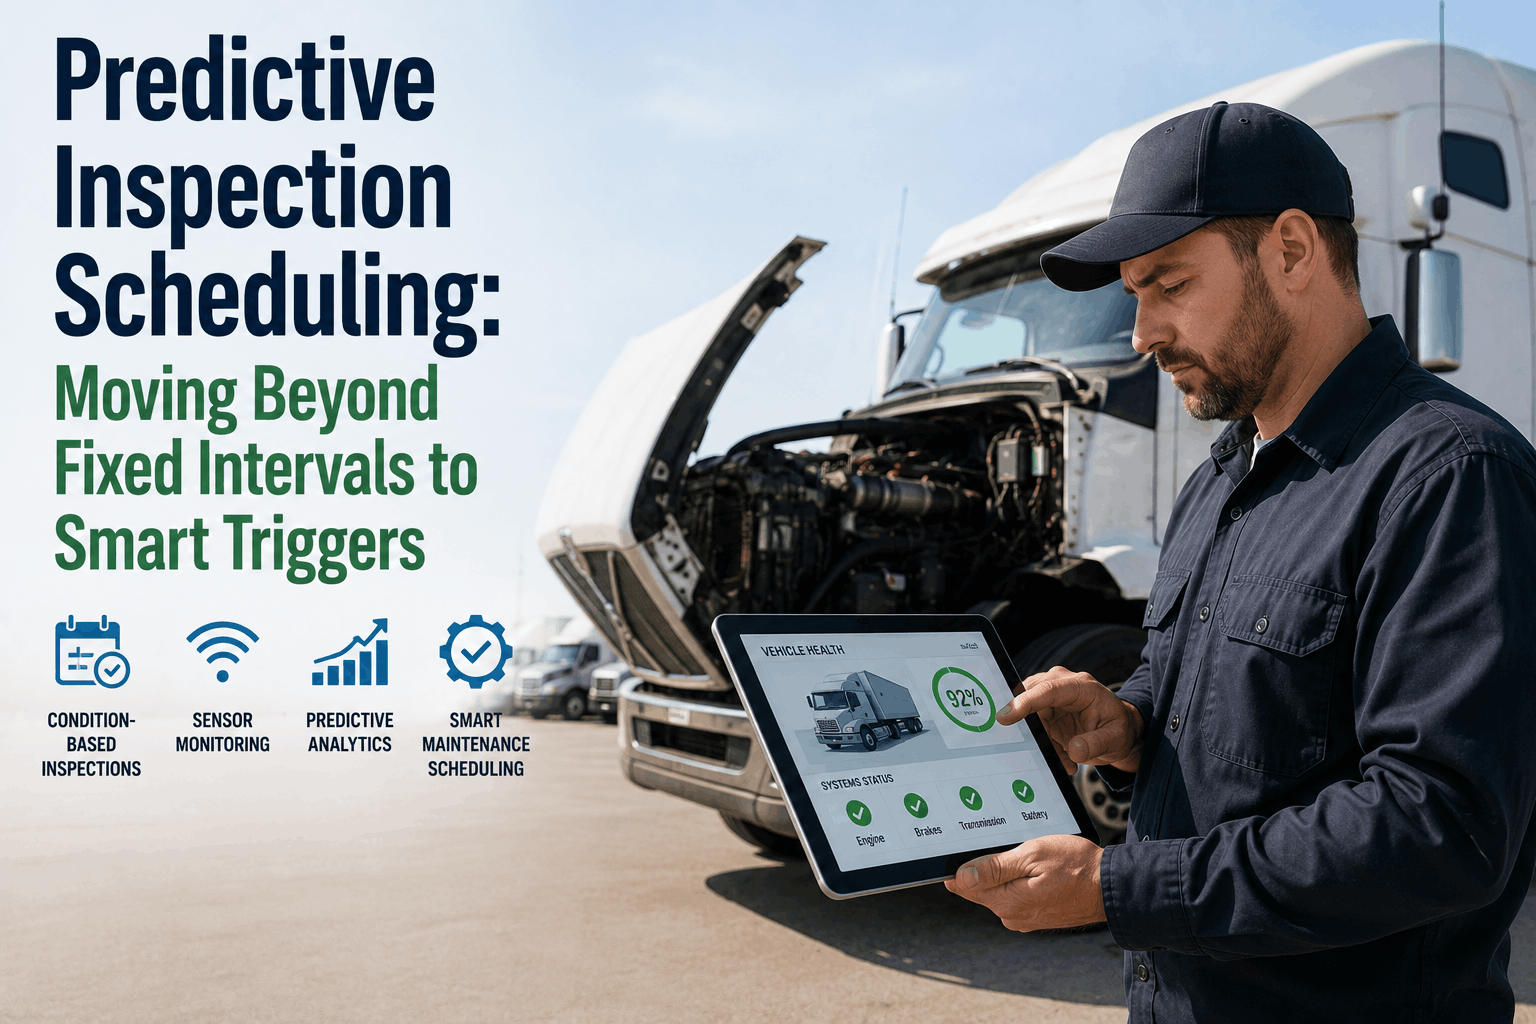
There is a fundamental flaw built into every fixed-interval maintenance schedule ever written: it assumes your vehicles age uniformly. Service every 10,000 miles, change oil every 90 days, inspect brakes every 6 months — these rules were designed for the average case. But your fleet does not operate in average conditions. A truck running city delivery routes with frequent stop-and-go braking degrades its brake components on a completely different curve than an identical truck doing steady-state highway miles. Servicing both vehicles on the same calendar schedule means one is serviced too often and one not enough. Predictive inspection scheduling breaks this logic entirely — replacing time-based rules with sensor-triggered, data-driven service decisions that reflect how each vehicle is actually aging in real operating conditions.
Predictive Inspection Scheduling: Moving Beyond Fixed Intervals to Smart Triggers
Why Fixed-Interval Schedules Are Costing You More Than You Think
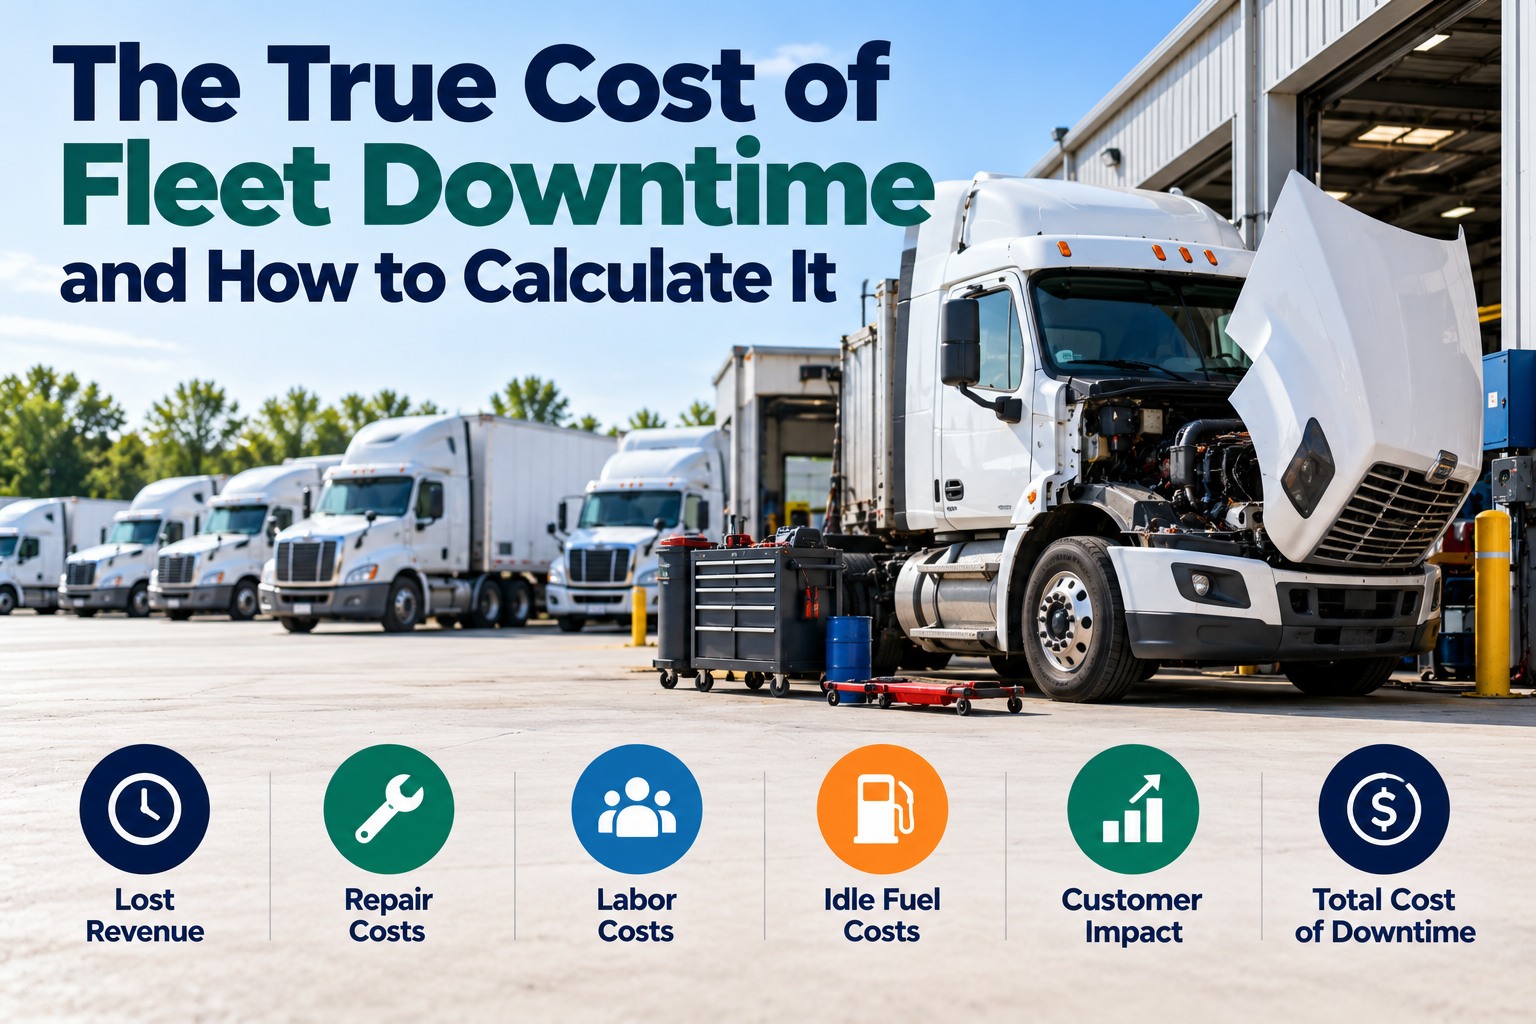
Fixed-interval maintenance — servicing vehicles on predetermined time or mileage thresholds regardless of actual condition — produces two distinct types of waste simultaneously. Vehicles running light-duty routes get serviced more frequently than their condition warrants, consuming maintenance labor, parts, and downtime that deliver no actual benefit. Vehicles running demanding duty cycles may exhaust their components before the scheduled interval arrives, resulting in the unplanned breakdowns that cost 4 to 5 times more than the same repair performed in a controlled shop environment.
The numbers behind this inefficiency are significant. A 35-vehicle fleet running fixed-interval scheduling spent $620,000 annually on maintenance — after switching to condition-based scheduling driven by telematics and sensor data, that same fleet reduced its annual maintenance spend to $410,000, saving $210,000 per year with the system paying back over three times its cost. Studies across commercial fleet deployments show predictive maintenance programs consistently reduce unplanned downtime by 32% and maintenance costs by 20 to 40%. Sign up with FleetRabbit to see what condition-based scheduling can recover from your fleet's current maintenance budget.
What Predictive Inspection Scheduling Actually Means
Predictive inspection scheduling replaces the fixed calendar with a dynamic trigger system. Instead of asking "when is this vehicle's next scheduled service?", the system continuously asks "what is this vehicle's current condition, and does it need attention now?" Service events are generated not by the passage of time but by the crossing of condition thresholds — sensor readings, performance metrics, fault code patterns, and usage data that indicate a component is approaching a state where intervention is required.
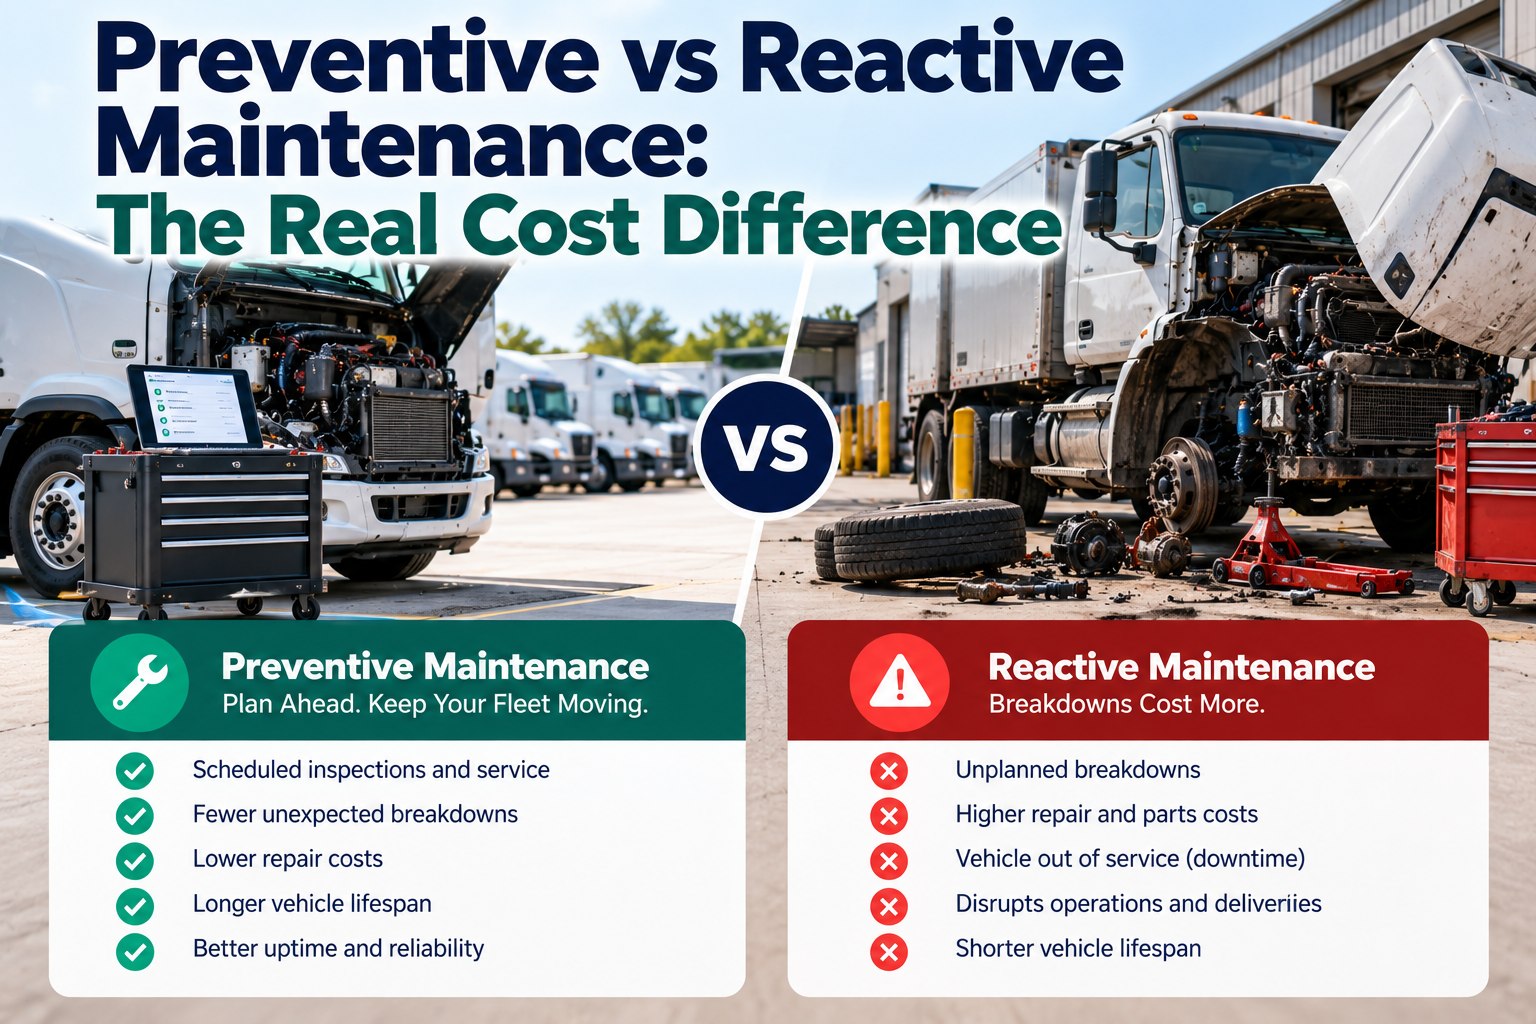
This is fundamentally different from both reactive maintenance (fixing what breaks) and traditional preventive maintenance (servicing on a fixed schedule). Predictive inspection scheduling sits at the intersection of real-time data and machine learning, using continuous monitoring to surface the right vehicle, for the right service, at the right time — not simply the next vehicle on the calendar queue. Book a FleetRabbit demo to walk through how smart trigger scheduling applies to your specific fleet's duty cycle and maintenance workflow.
Service is triggered only by failure or driver complaint. Maximum flexibility, maximum cost. Emergency repairs, roadside breakdowns, and unplanned downtime dominate the maintenance budget.
Service is triggered by time or mileage thresholds applied uniformly across all vehicles. Reduces breakdowns but creates over- and under-maintenance waste simultaneously.
Service is triggered by actual vehicle condition — sensor thresholds, fault pattern analysis, and ML-driven risk scoring. Each vehicle is serviced exactly when its condition demands it.
FleetRabbit's predictive inspection engine monitors every vehicle in your fleet continuously — generating smart service triggers based on actual condition data, not arbitrary time intervals.
The Data Inputs That Drive Smart Inspection Triggers
Predictive scheduling is only as intelligent as the data feeding it. Modern commercial vehicles generate hundreds of real-time signals that, when aggregated and analyzed by machine learning models, enable condition-based inspection triggers with far greater precision than any fixed interval can achieve. Systems like Intangles monitor over 450 real-time vehicle signals per asset across more than 2,000 engine configurations — creating a continuous health profile that surfaces risk 20 to 45 days before traditional diagnostics would raise an alarm.
The power of this data is not in any single signal — it is in the pattern recognition that machine learning applies across multiple signals simultaneously. A brake temperature reading alone might not trigger a service alert. But a brake temperature trend combined with an increase in ABS activation frequency, a slight increase in stopping distance from telematics data, and a TPMS reading showing one rear tire consistently 8 PSI below the others — that combination surfaces a brake system inspection need weeks before a breakdown would occur. Sign up with FleetRabbit and start feeding your fleet's sensor data into a predictive inspection engine today.
From Triggers to Work Orders: The Automated Scheduling Workflow
One of the most practical advantages of predictive inspection scheduling is not just that it identifies what needs attention — it is that it automates the workflow from detection to scheduled repair. When a condition threshold is crossed or an ML model flags an elevated risk score for a specific component, the system generates a prioritized maintenance alert that flows directly into the shop management workflow as a pre-populated work order: vehicle ID, flagged component, sensor readings, recommended service action, and urgency level. The maintenance manager reviews, approves, and schedules the repair during the next available planned downtime window — with parts already sourced because the system generated the parts requirement alongside the alert.
Parts procurement alone justifies significant investment in predictive scheduling infrastructure. Planned parts purchasing 3 or more weeks ahead costs 15 to 30% less than emergency sourcing at spot rates. Technician productivity improves 15 to 25% when capacity shifts from unplanned breakdown responses to pre-scheduled inspections where the diagnosis is already complete before the vehicle enters the shop. Every prevented breakdown also avoids $760 or more per day in vehicle downtime, plus towing costs, missed delivery penalties, and the downstream schedule disruptions that ripple across the entire operation. Book a FleetRabbit demo to see how the trigger-to-work-order workflow is implemented in practice.
The ROI Case for Predictive Scheduling in Commercial Fleets
The business case for transitioning from fixed-interval to predictive inspection scheduling is supported by consistent, measurable data across fleet sizes and industries. A 250-vehicle fleet that deployed condition-based maintenance scheduling achieved $1.8 million in annual savings — driven by a 30% reduction in maintenance costs, a 45% decrease in downtime, and a 60% reduction in emergency repairs. Even at the small-fleet level, a 35-vehicle operation reduced annual maintenance spend by $210,000. The predictive maintenance market itself — valued at $10.93 billion in 2024 and projected to reach $70.73 billion by 2032 at over 35% annual growth — reflects how broadly this ROI is being validated across industries.
The compounding effect of predictive scheduling ROI comes from five sources that each stand independently. Emergency repair costs are 4 to 5 times the equivalent planned repair. Parts purchased with 3-plus weeks of lead time cost 15 to 30% less than emergency sourcing. Technician productivity improves 15 to 25% when unplanned breakdown work is replaced by pre-scheduled inspections. Each prevented breakdown eliminates $760-plus in daily downtime costs. And component lifespan extends 20 to 40% when serviced at the right condition point rather than at a blunt interval. Start your free FleetRabbit account and begin building the data foundation that makes these results achievable for your fleet.
FleetRabbit replaces fixed-interval service calendars with smart condition triggers — scheduling each vehicle for inspection only when its actual sensor data says it's time.