A returnable container pool is working capital in motion, and most plants manage it as if it were packaging. That distinction is not semantic. Packaging is a consumable you order when you run short; a pool is a finite fleet of assets circulating through a loop, where every unit that goes missing has to be replaced with capital and every unit you own beyond the loop's requirement is capital doing nothing. Both errors are invisible in a purchasing report — the first appears as a routine replacement order, the second as an asset nobody counts. Meanwhile the pool is the only physical thing in the plant that is simultaneously an inventory constraint, a transport constraint and a line-side constraint, and total cost of ownership analyses only start favouring reusable systems after roughly ten to fifteen rotation cycles, which means the economics depend entirely on the loop actually turning. Book an architecture review to size your own pools against real cycle times.
BEST PRACTICES · CONTAINER POOLS
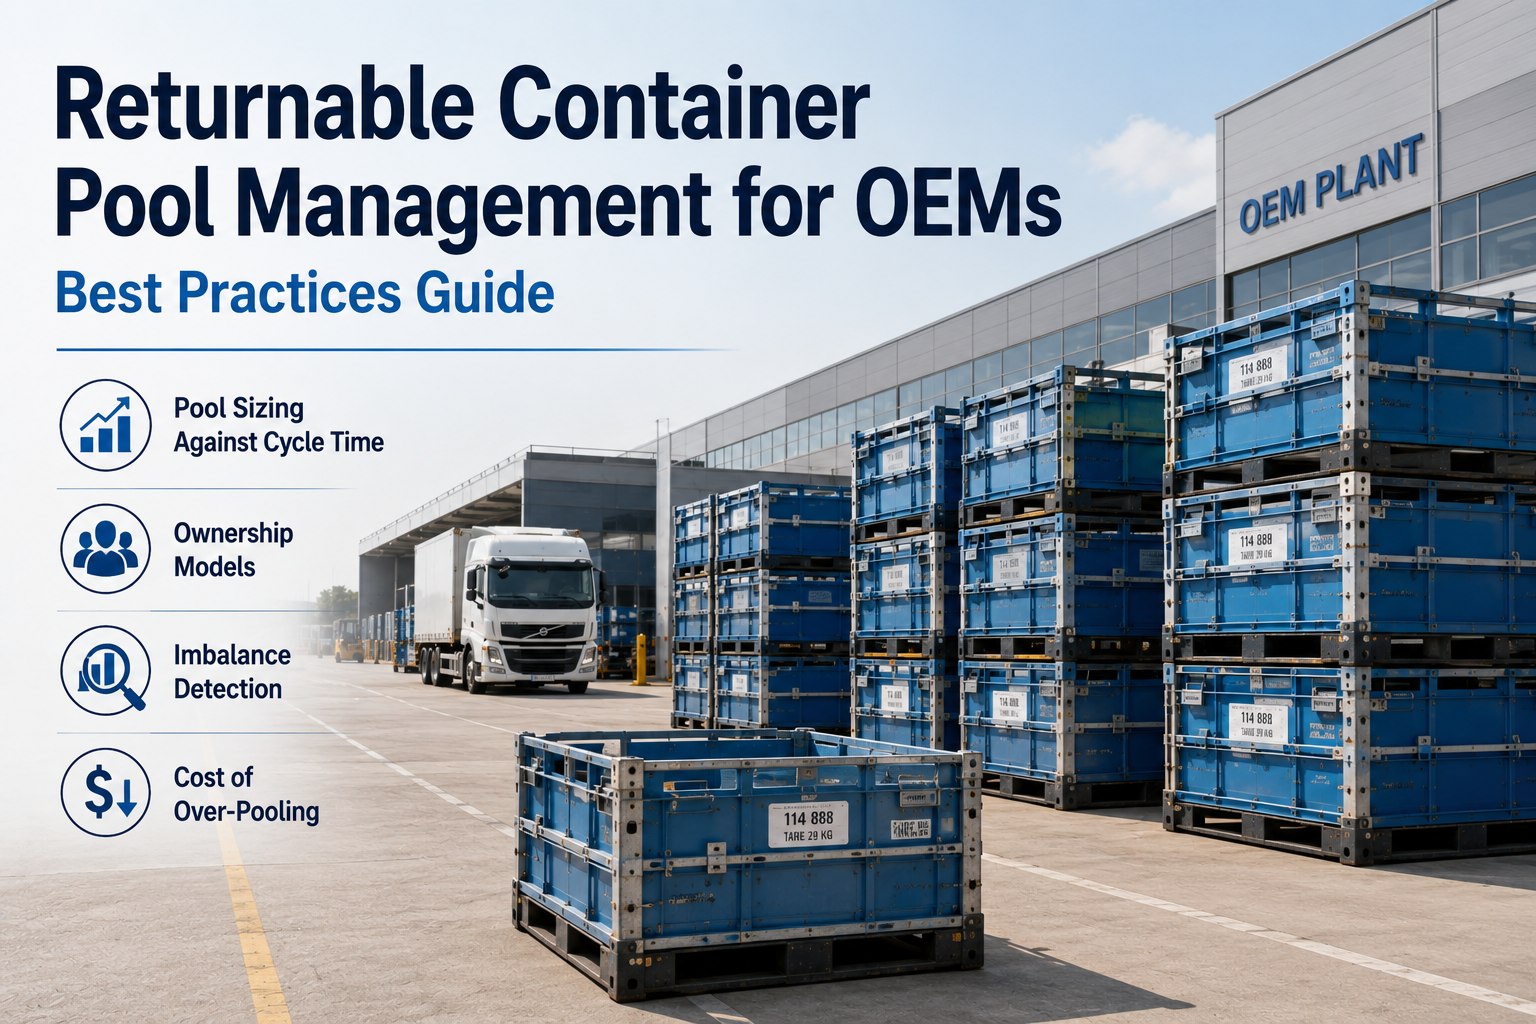
Returnable Container Pool Management
Pools sized against measured cycle time rather than against last year's order, ownership and loss liability decided explicitly, imbalance caught before it becomes a shortage, and the cost of over-pooling made visible.
Supplier fill
Inbound transit
Plant staging
Line-side
Empty pool
Return leg · collection, cleaning, inspection
Every unit in the pool is in exactly one of these five states at any moment. If you cannot say how many are in each, you cannot size the pool — you can only buy more.
Where the Pool Physically Sits
Sizing starts by accounting for the whole loop rather than the part you can see. The plant sees two states out of five, which is why plant-side counts always understate what the pool needs to be.
At the supplier
Empties awaiting fill, containers being filled, and full containers awaiting collection. Invisible to you and frequently the largest single share.
Sized bySupplier fill frequency and collection cadence
In transit inbound
Full containers on the road or at sea. Fixed by geography, and the reason distant suppliers need disproportionately large pools.
Sized byTransit time × consumption rate
In the plant
Staged in the yard, in the supermarket, and at line-side. The only share most plants measure, and typically a minority of the total.
Sized byStaging policy and line-side coverage target
In the empty pool
Emptied and awaiting collection. Grows silently when the return leg is unreliable, and consumes yard positions while it does.
Sized byCollection frequency, not by consumption
In return transit and service
On the return leg, being cleaned, inspected or repaired. Routinely omitted from sizing because it is nobody's operational concern.
Sized byReturn transit plus cleaning and inspection turnaround
Shrinkage allowance
Units lost, stolen, damaged beyond repair or stranded at a site nobody is tracking. Loss and theft drive avoidable capital expenditure and emergency procurement.
Sized byMeasured loss rate, per container type — not a single blended figure
The sizing question, stated properly
Pool size is cycle time multiplied by consumption rate, divided by units per container, plus a shrinkage allowance. Every term in that expression is measurable and most plants measure none of them — which is why pools are almost always sized by adding to last year's number until the shortages stop.
If you cannot state your cycle time, you cannot know whether you are short or over-invested.
An architecture review measures the five loop states for your highest-value container types and produces a sized pool with the shrinkage allowance derived from your own loss data rather than a benchmark.
Ownership Models and Who Carries the Loss
The commercial structure determines who has an incentive to return containers, and that incentive matters more than any tracking technology. Choose deliberately rather than inheriting whatever was agreed part by part.
← Swipe to see all columns →
Pool operators such as the large pallet networks take organisational responsibility — managing inventories, coordinating returns and cleaning, and charging usage fees rather than purchase prices. Liability for lost units is contractually regulated: users are generally liable for units not returned, while the operator calculates shrinkage rates and absorbs them systemically. Because pooling removes per-supplier capital investment in containers, it is particularly attractive to smaller suppliers who cannot justify a dedicated fleet, with the operator's per-trip premium still below the per-trip cost of single-use packaging.
Open Loops Are Harder Than Closed Ones
The distinction decides how much governance you need. In open reusable systems — cycles with changing recipients that are not centrally controlled — return logistics are considerably more challenging, because containers must come back across multiple stations with no single entity controlling the whole flow.
Closed loop
Fixed set of known participants
One party can see and control the whole flow
Return obligations enforceable directly
Shrinkage traceable to a specific handover
Governance requirement: return deadlines and condition standards in the supplier agreement.
Open loop
Changing recipients, no central control
Containers cross multiple stations before returning
Return depends on parties with no direct relationship to you
Shrinkage attributable only statistically
Governance requirement: a pool operator, or accept structurally higher loss.
The Cost of Over-Pooling
Under-pooling stops the line, so it gets fixed. Over-pooling costs money quietly and forever, so it does not — and adding units is the standard response to almost every pool problem regardless of cause.
Capital tied up in excess assetsEvery surplus container is working capital that could be elsewhere. Real-time visibility is what allows pool sizes to be optimised and capital in excess inventory to be released.
Yard and storage positions consumedA larger pool has to sit somewhere, and the surplus tends to sit as empties in yard positions that inbound volume needs.
Cleaning, inspection and repair overheadScales with fleet size rather than with usage, so a pool sized for the worst week costs its maintenance every week.
Loss rate rises with pool sizeMore units in circulation with the same tracking discipline means more units unaccounted for. Excess pool hides shrinkage rather than absorbing it.
The underlying problem stays hiddenA pool oversized to cover a slow return leg means the return leg never gets fixed, because the symptom stopped appearing.
Rotation economics degradeReusable systems pay back after a number of rotation cycles. A container that rotates less often because the pool is oversized takes proportionally longer to justify itself.
The diagnostic pairing
High pool count alongside low rotation frequency is the over-pooling signature, and it is easy to confirm: divide annual trips by pool size. A pool where each unit completes only a handful of cycles a year is not a buffer — it is a warehouse of packaging that happens to be spread across your network.
Imbalance Detection
Pools do not usually fail globally. They fail locally — surplus accumulating at one site while another runs short — and the aggregate count looks healthy throughout. Idle assets and imbalances create shortages at high-throughput sites while excess piles up elsewhere.
1Net drift per laneUnits in against units out per site pair, over time. Persistent one-way drift is the earliest reliable signal, and it appears months before a shortage.
2Dwell in the empty stateHow long units sit emptied and uncollected, by site. Rising dwell at one location means the return leg there is failing, not that the pool is small.
3Site-level coverage against local requirementEach site needs its own coverage figure. A network-level count is precisely the number that conceals the problem.
4Return compliance rate by partnerShare of units returned within the contracted deadline, per supplier or recipient. Turns an aggregate loss figure into an accountable one.
5Units unseen beyond a thresholdNot yet declared lost, not seen for weeks. This population is where shrinkage accumulates before anyone writes it off.
6Rebalancing moves executedImplement rebalancing procedures that address imbalances before they affect operations, and count the moves — rising volume means the network's structural imbalance is growing.
Contract Terms That Prevent Shrinkage
Tracking technology finds containers. Contracts create the reason to return them. Enshrining return obligations in supplier and customer agreements is what makes the cycle economically viable — clear rules on deadlines, condition and liability minimise shrinkage.
Return deadline per container typeStated in days from emptying, not "promptly". A deadline without a number is not enforceable and will not be measured.
Condition standard on returnWhat constitutes returnable versus damaged, and who assesses it. Ambiguity here becomes a dispute at every collection.
Liability for non-returnUsers generally liable for units not returned. State the replacement value and the trigger point explicitly.
Collection obligation and cadenceWhose responsibility, at what frequency. Un-collected empties are as much a failure as un-returned ones.
Identity and labelling requirementConsistent identity per unit, following recognised encoding standards for universal compatibility across partners.
Data sharing obligationPartners report movements, not just exceptions. Fragmented data prevents network-wide optimisation of container flows.
Size the Pool From the Loop, Not the Ledger
An architecture review measures the five loop states for your priority container types, derives the shrinkage allowance from your own loss data, tests the ownership model against your loop structure, and sets out the imbalance signals worth alerting on. The output is a sized pool per container type you keep regardless of what you do next.
Five-state loop measurement
Ownership and liability review
Shrinkage from your own data
Imbalance alert design
What to Measure
The core set for pool management. Loss rate, average cycle time, utilisation, cost per trip and return compliance are the metrics that give genuine insight into how the fleet is performing. Our analytics and reporting module carries them per container type.
Loss rate per container typeNot blended. Different container types leave the loop for different reasons and at very different rates, and a blended figure obscures both.
Average cycle timeFull loop, supplier fill to supplier fill. The input to pool sizing, and the figure that changes when anything in the network changes.
Rotation frequency per unitAnnual trips divided by pool size. Reusable economics improve with rotations, so this is the number that determines whether the fleet is paying back.
Utilisation rateShare of the pool in a productive state rather than waiting. Low utilisation with adequate coverage is the over-pooling indicator.
Cost per tripAll-in, including cleaning, repair, replacement and rebalancing transport. The comparator against single-use alternatives.
Return compliance rateBy partner, against the contracted deadline. Converts shrinkage from an accepted cost into an accountable one.
Frequently Asked Questions
How do we size a pool properly?
Cycle time multiplied by consumption rate, divided by units per container, plus a shrinkage allowance from your own measured loss rate. The critical part is measuring cycle time across all five loop states rather than the two the plant can see — containers at the supplier awaiting fill or collection, and units in return transit or being cleaned and inspected, are usually a majority of the fleet and are routinely omitted. Size per container type, because cycle time and loss rate both vary substantially between them.
Should we own the pool or use an operator?
It depends mainly on whether your loop is closed or open. Closed loops with a stable supply base and custom racks are usually best owned, since you can see and enforce the whole flow. Open loops with changing recipients are considerably harder — containers must return across multiple stations with no single entity controlling the flow — and that is where operators earn their fee by managing inventories, coordinating returns and cleaning, charging usage rather than purchase, and absorbing shrinkage systemically while users remain liable for units not returned.
How do we know if we are over-pooled?
Divide annual trips by pool size. A low rotation frequency alongside adequate coverage is the signature — the pool is large enough that units spend most of their life waiting rather than moving. Over-pooling also shows as low utilisation, empties occupying yard positions, and cleaning and repair overhead that scales with fleet size rather than usage. The real cost is that the oversized pool conceals whatever return-leg problem prompted the last expansion, so it never gets fixed.
Why does the aggregate count look fine while sites run short?
Because pools fail locally rather than globally. Idle assets and imbalances create shortages at high-throughput sites while excess accumulates elsewhere, and the network total stays constant throughout. Measure coverage per site against local requirement, track net drift per lane, and implement rebalancing procedures that act on imbalances before they affect operations. Strategic positioning of assets across the network also reduces transport cost and improves responsiveness, so rebalancing is not purely defensive.
Is tracking technology enough to control shrinkage?
Necessary but not sufficient. Consistent inventory tracking via RFID, barcodes or pool management software is a fundamental operational requirement for achieving positive total cost of ownership rather than an optional extra — but most programmes fail on visibility, asset loss, manual tracking and poor accountability across suppliers and locations, and only two of those four are technology problems. Contracted return deadlines, condition standards and liability for non-return are what create the incentive that tracking then enforces.
How many cycles before reusables pay back?
Total cost of ownership analyses consistently favour reusable systems after roughly ten to fifteen rotation cycles, depending on application intensity — which makes rotation frequency, not unit cost, the variable that decides the business case. A container that completes eight cycles a year takes years to justify; the same container completing thirty pays back in months. That is why over-pooling is more damaging to the economics than a slightly higher unit price, and why cycle time deserves the measurement attention.
Where should we start?
Pick your two or three highest-value container types and measure the five loop states for those only. A full-fleet exercise stalls; a focused one produces a defensible sized pool within weeks and usually reveals that the largest share of the fleet is sitting somewhere nobody was counting. From there, tighten identity and labelling for those types, then extend. Our
integrations overview covers the tracking and data surface.
Treat the Pool as a Fleet
Sized from measured cycle time across all five loop states, ownership and liability written down, imbalance detected per lane rather than per network, and rotation frequency tracked as the number the economics actually turn on.