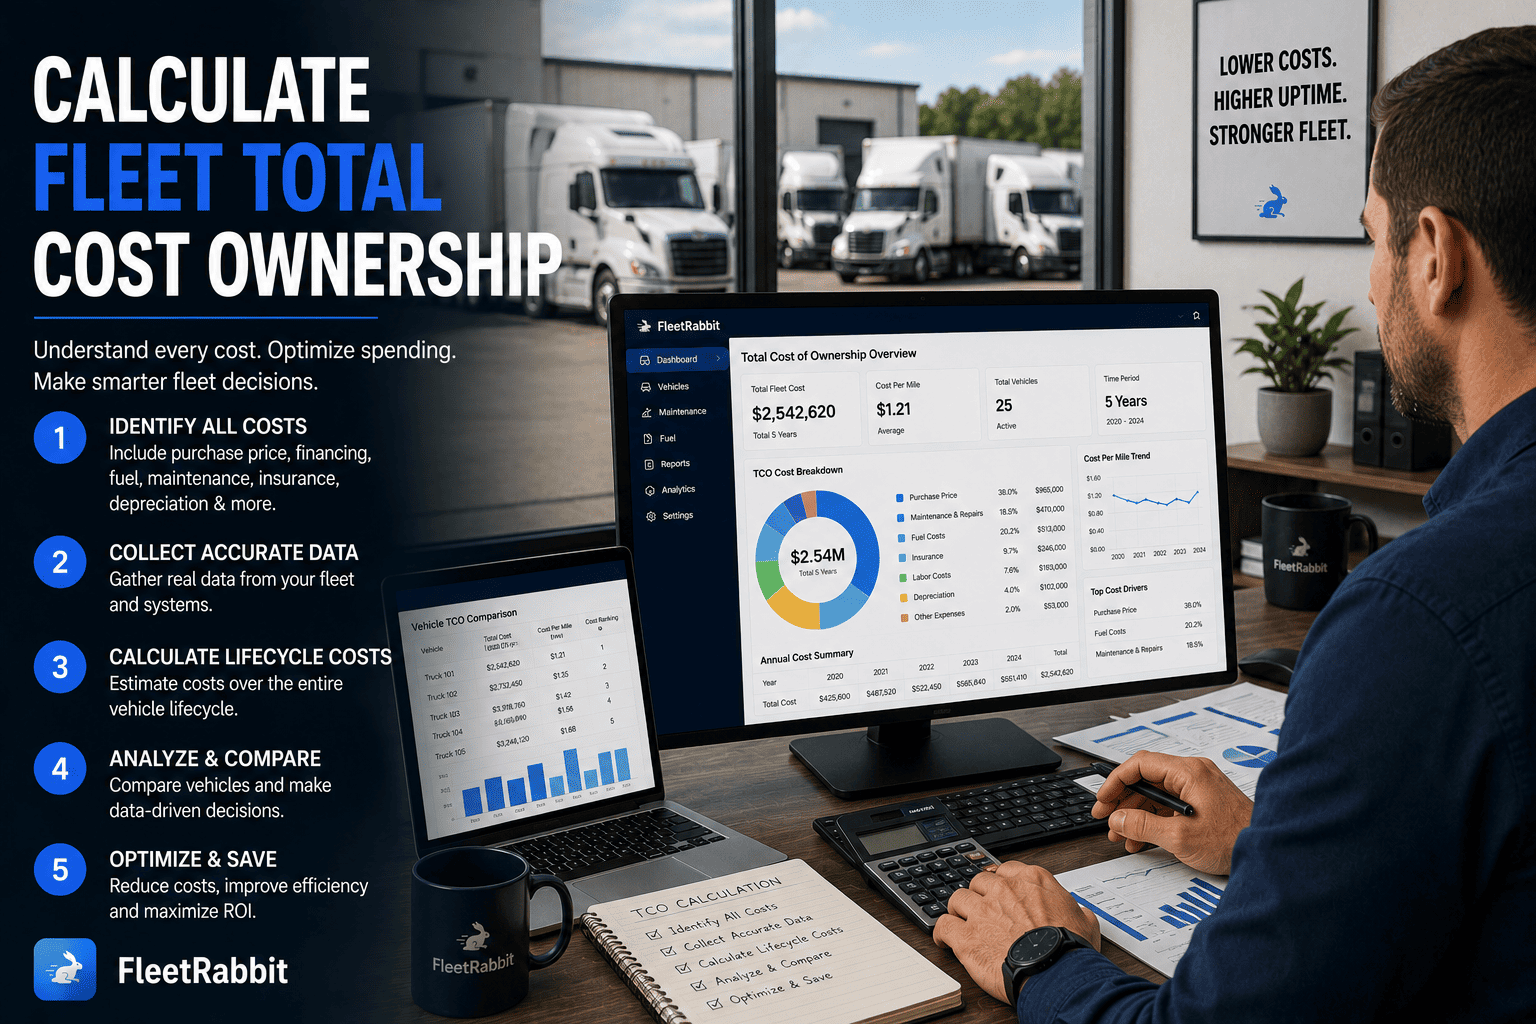
Most fleets can produce a maintenance figure for any given truck. Far fewer can produce the whole number — depreciation, financing, insurance, fuel, maintenance, tyres, vendor repairs and downtime, per asset, for the year. That gap matters because total cost of ownership is not really a reporting exercise; it is the input to the single most expensive decision a fleet makes repeatedly, which is when to replace a vehicle. Industry data for 2025 put the all-in operating cost of a Class 8 tractor at $2.336 per mile across a sample of 178,091 tractors and 14.08 billion miles. The question is not whether your fleet is near that number. It is whether you can tell which of your trucks is above it and why. Book a demo to see cost per asset calculated from records you already keep.
Calculate Fleet Total Cost of Ownership
The formulas, the benchmark figures, the costs most fleets leave out, and the point in a vehicle's life where the arithmetic says replace it
The Two Formulas Worth Knowing
Everything else on this page is sourcing data to fill these in. The second is the one you actually manage against.
Where Each Number Comes From
Five buckets. The last two are where most calculations quietly fail.
| Cost bucket | What it includes | Where to source it | What gets missed |
|---|---|---|---|
| Acquisition & capital | Purchase or lease payments, financing interest, taxes, upfitting | Finance system, lease schedule | Cost of capital on cash purchases — the return that money could have earned elsewhere |
| Fuel | Fuel and DEF consumption per asset | Fuel cards, telematics | Nothing usually — this is the best-captured bucket in most fleets |
| Maintenance & tyres | Parts, labour, outsourced repairs, tyres, fluids, compliance servicing | Work orders, invoices, vendor statements | Vendor and roadside repairs paid outside the workshop system |
| Depreciation | Value lost across the period, against realistic residual | Book value, market guides | Acceleration caused by poor maintenance documentation at resale |
| Downtime | Revenue not earned while the asset is out of service | Work order duration, dispatch records | Almost all of it — this bucket is absent from most calculations entirely |
Bring twelve months of work orders and fuel records to a 30-minute session and we'll build cost per mile per asset in Fleet Rabbit — including the downtime hours already sitting in your work order durations, which is usually the first time that bucket has ever been counted.
Benchmarks to Measure Against
Figures published for 2025 and 2026. Treat them as orientation — class mix, duty cycle and utilisation move them considerably.
The Cost Curve Nobody Budgets For
Annual TCO is not flat. It dips, then climbs, and the last stretch of an average lifecycle carries disproportionate cost.
| Ownership year | What is happening | Maintenance profile | Decision posture |
|---|---|---|---|
| Year 1 | High payment, low maintenance, warranty covering most repairs | Minimal — depreciation is heaviest here and entirely silent | Nothing to do but record the baseline properly |
| Year 2 | Major systems still under warranty, preventive cadence established | Roughly $12,000–$18,000 annually | Best cost per mile of the whole ownership period |
| Year 3 | Warranty coverage expiring, aftertreatment repairs beginning | The step change starts here | Begin tracking the trend line, not just the total |
| Year 4 | Injector work, turbocharger and transmission risk emerging | Climbing, with downtime hours rising alongside | The fleet decision point — model replace against repair |
| Year 5 | Major component risk peaks, roadside events more frequent | Roughly $25,000–$35,000 annually | Residual falls steeply beyond here if the asset is held |
Making the Replace-or-Keep Call
Four inputs. The decision is not a fixed age — it is the point where two curves cross.
How Fleet Rabbit Produces the Number
Frequently Asked Questions
Annual TCO is acquisition plus operating and administrative costs plus depreciation plus downtime, per asset. Divide that by annual miles to get cost per mile, which is the comparable figure — a fleet with $226,000 of annual cost across 100,000 miles runs at $2.26 per mile. For procurement decisions, use the lifecycle form instead: purchase price minus residual, plus annual running costs multiplied by ownership years.
Industry data put all-in Class 8 operating cost at $2.336 per mile for 2025, across a sample of 178,091 tractors and 14.08 billion miles, with maintenance and repair at roughly $0.202 per mile or 8.9% of the total. Top-quartile fleets achieve $0.12 to $0.18 on maintenance while the bottom quartile exceeds $0.30. Those figures skew toward large Class 8 operations, so mixed or vocational fleets should expect a materially different benchmark.
Downtime, almost universally. Also the cost of capital on cash-purchased assets, vendor and roadside repairs paid outside the workshop system, and depreciation accelerated by incomplete service documentation at resale. Together these invisible costs are estimated at $0.35 to $0.55 per mile — more than the entire maintenance line in most fleets, which is why an incomplete calculation is worse than no calculation.
Where the rising cost of maintenance and unplanned downtime begins to exceed residual value — commonly cited at three to five years for many commercial trucks, though duty cycle moves it considerably. Watch the trend rather than the level: maintenance spend roughly doubles between year two and year five, from around $12,000–$18,000 to $25,000–$35,000 annually, while resale drops steeply once the window passes. Waiting until the case is unarguable usually means the residual has already gone.
Reported figures put unplanned downtime at roughly $400 to $760 per truck per day in lost revenue. Most fleets never count it because it produces no invoice — but the data usually already exists in work order open and close times, which makes it one of the easier gaps to close once someone decides to measure it.
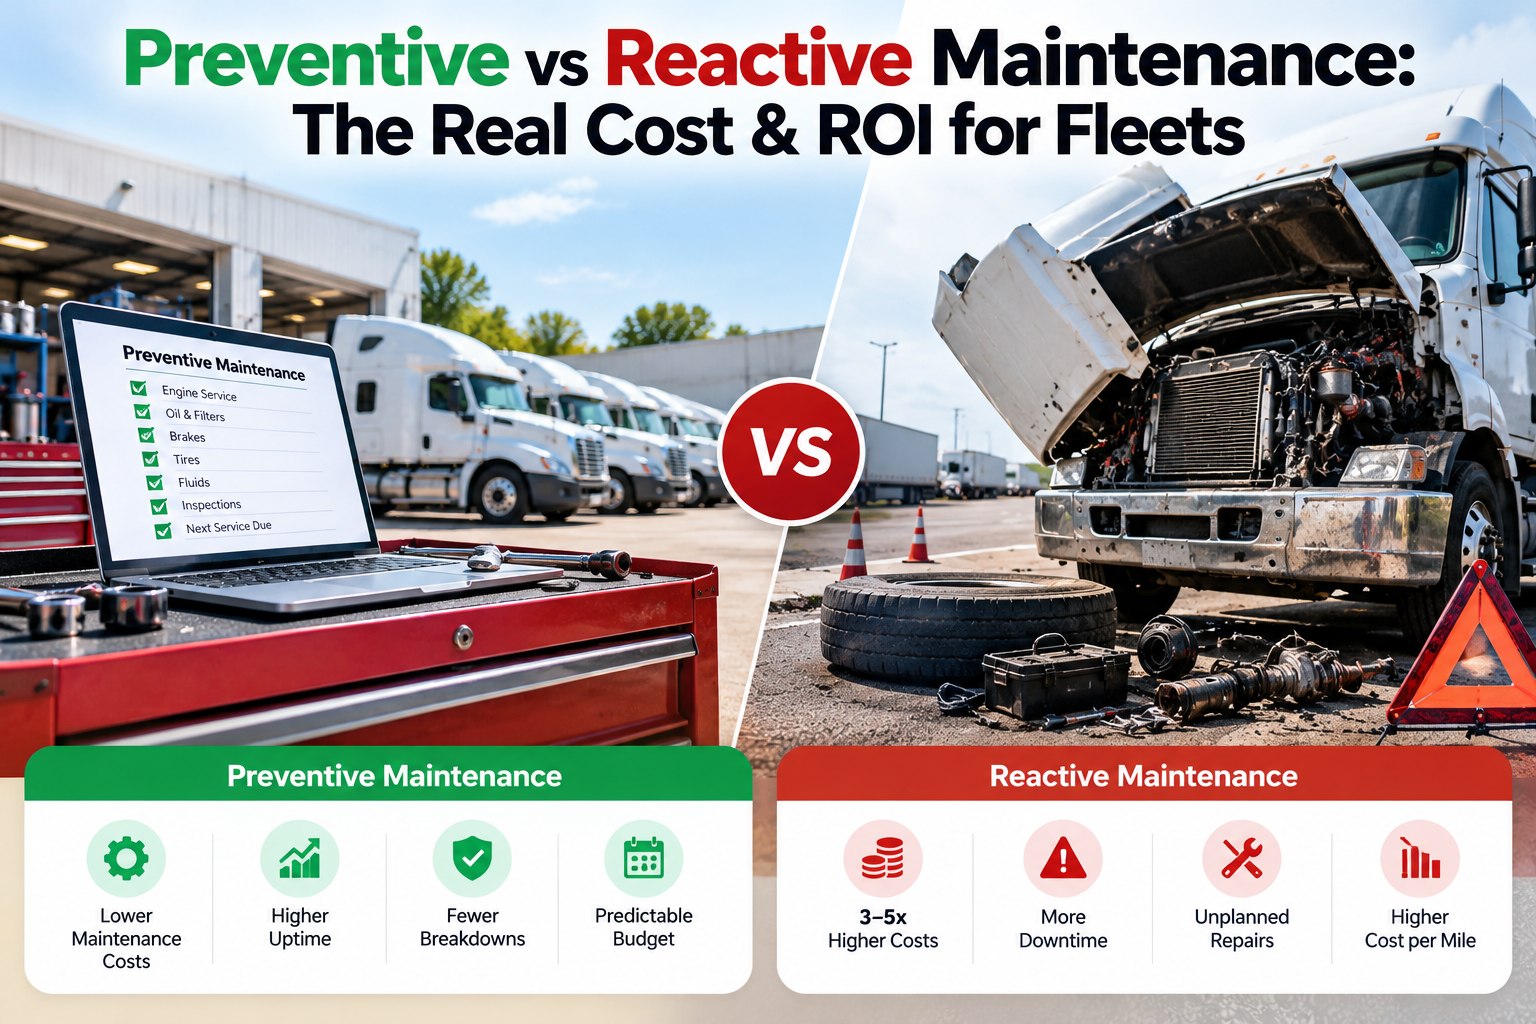
Materially. Reactive repairs are reported to cost three to nine times the equivalent planned work, and the gap between top and bottom quartile maintenance cost per mile is attributed to calculation discipline and the planned-to-reactive ratio rather than to fleet size. Preventive scheduling is the lever most directly under your control. Start free and track the ratio from the first work order.
For the cost categories and definitions, see understanding fleet total cost of ownership. For a step-by-step process, see calculating TCO for your fleet operations. For electric versus diesel comparison, see the EV fleet TCO calculator.