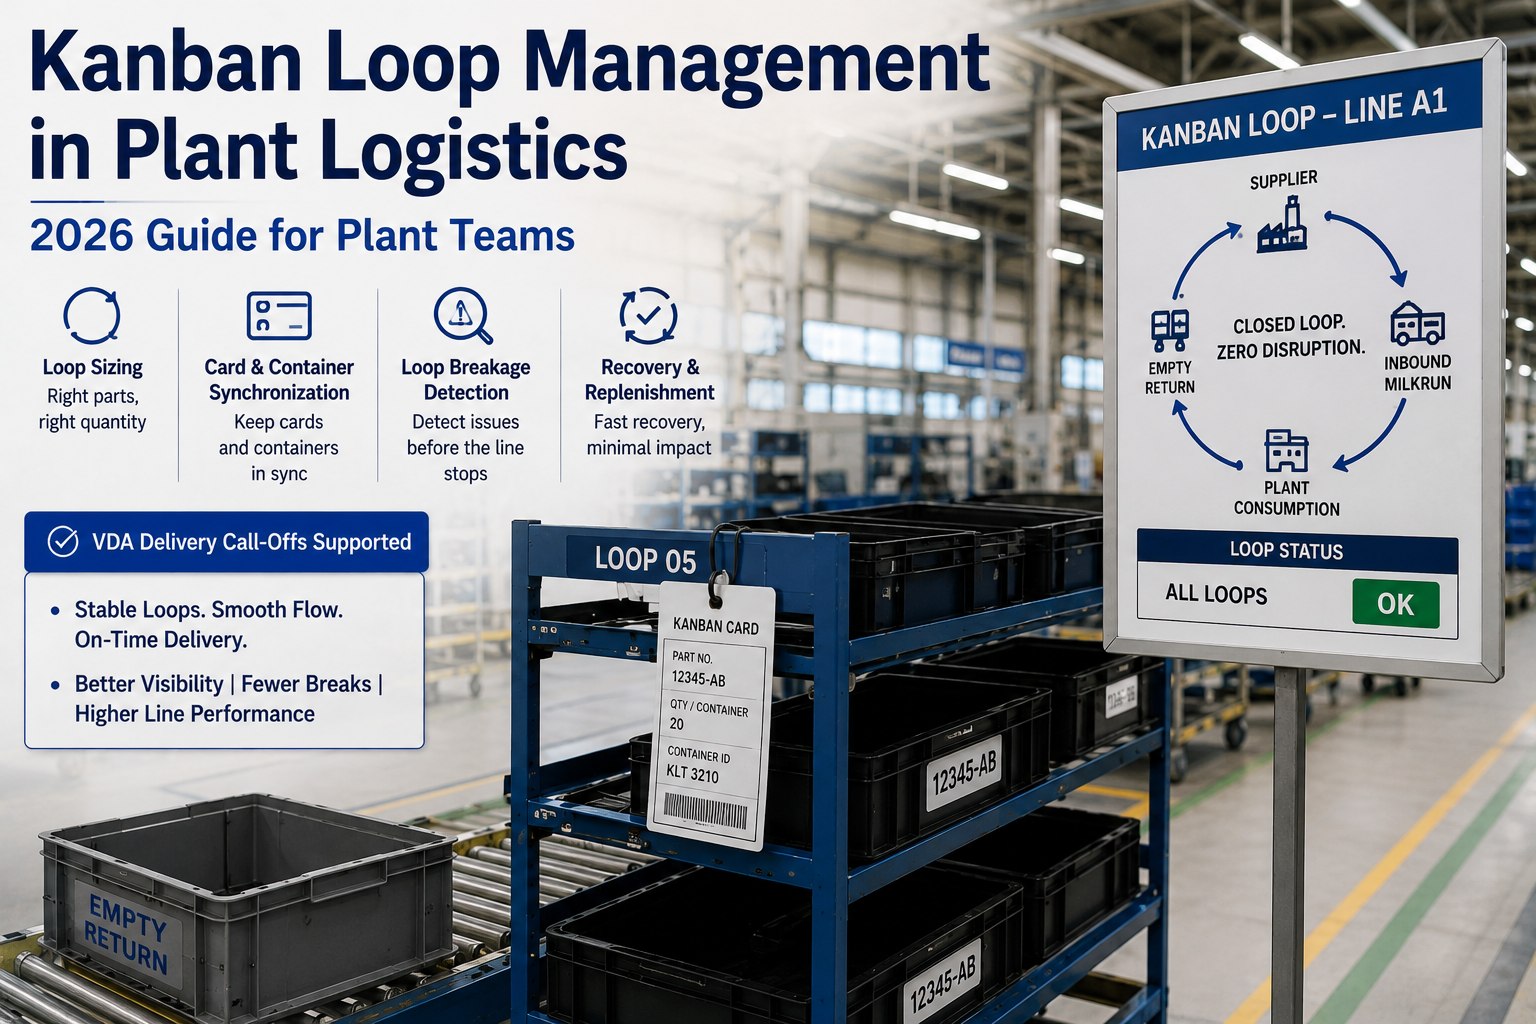
Kanban sizing goes wrong for a reason that has nothing to do with arithmetic: the formula is easy and the inputs are not. Almost every plant that reports a struggling loop has used lead time where replenishment time belongs — and those are different quantities. Replenishment time is the round trip: from the moment a card leaves the supermarket until that same card comes back with a part in it. That includes waiting time in the supermarket, transport in both directions, queueing at the supplying process, and the fluctuations the loop is meant to absorb. Lead time is usually just the making. Substitute one for the other and you will size a loop that starves the line while the calculation says it should be comfortable, and the response is almost always to add a card rather than to revisit the input. This covers sizing honestly, keeping cards and containers synchronised, and detecting a broken loop before the line does. Ask for the deployment brief to size your own loops against real replenishment times.
2026 GUIDE · FOR PLANT TEAMS
Kanban Loop Management in Plant Logistics
Sizing loops from replenishment time rather than lead time, keeping card and container populations synchronised, detecting breakage before it reaches the station, and knowing when to resize instead of adding a card.
N=D × T × (1 + X)C
NCards in the loop
DDaily demand
TReplenishment time
XSafety factor
CContainer quantity
T Is Not Lead Time
This is the input that decides whether the whole calculation is useful. Replenishment time is the full round trip of one card — from leaving the supermarket to returning with a part. Build it from its components rather than borrowing a number from the supplier agreement.
The components of one card's round trip
Waiting in the supermarketThe card sits in the collection point until the next pickup. Routinely omitted, and often the largest single component on a low-frequency route.
Transport to the supplying processMilk run leg, internal transfer, or external transport. Measured on the actual route frequency, not the theoretical one.
Queue at the supplying processTime before the signal is acted on. Where the supplying process batches, this is a function of batch size rather than of speed.
Production or pickingThe only component most people include, and frequently the smallest.
Return transport and restockingGetting the filled container back into the supermarket and available for pull. The loop is not closed until it is on the shelf.
Plus disruption coverageBreakdowns and other problems the loop is expected to absorb. Decide explicitly how much of this belongs in T and how much in X — but do not count it twice.
The self-defeating loop
If a card takes an hour to complete its cycle and you sized only for average demand during that hour, the loop has no slack at all — the second cycle arrives with a single card of stock covering a full hour of demand. This is why estimating possible peak demand within one replenishment period matters: if you expect an additional hundred parts on top of the average hundred, and each kanban represents twenty parts, that is five additional cards before the safety factor is even applied.
A Worked Sizing
Inputs on the left, result on the right. Round up, always — a fractional card is a card you do not have.
Inputs
D — daily demand480 pieces
T — replenishment time0.5 day
X — safety factor0.25
C — container quantity40 pieces
T is 0.5 day because the route runs twice per shift — not because the supplying process takes half a day.
Result
480 × 0.5 = 240 pieces consumed during replenishment
240 × 1.25 = 300 pieces including safety
300 ÷ 40 = 7.5 containers
8cards in the loop
Eight cards caps work in process at 320 pieces. Sizing the loop is choosing the WIP limit, and by Little's Law capping WIP caps lead time for a given throughput.
The arithmetic takes a minute. Getting T right takes a walk of the route.
The deployment brief covers replenishment time measurement, card and container reconciliation, breakage detection, and how loop data connects to call-off reconciliation upstream.
Choosing the Safety Factor
Typical values run from roughly 10% to 50% of lead-time demand depending on demand variability, supplier reliability and item criticality, with most operations starting around 20–30% and adjusting from observed performance. Use this as a starting grid, not a rule.
← Swipe to see all columns →
A persistently high safety factor is a diagnosis, not a setting. It means variation is being paid for with inventory rather than removed, and the honest response is to fix the variation and reduce X — not to leave it and stop looking.
Loop Breakage: Six Modes
A loop fails in identifiable ways, and the symptoms are easy to confuse. Reading the symptom column first is usually the fastest route to a correct diagnosis.
Lost card
SymptomLoop quietly runs one card short. Stockouts appear at random intervals with no obvious trigger.
RecoveryIssue a clearly identified temporary fill card, removed the moment the original is found. Managed by the process owner, never issued informally.
Card–container divergence
SymptomCard count and physical container count disagree. Signals circulate without material, or containers move without authorisation.
RecoveryPeriodic reconciliation of both populations. The divergence is the metric; the individual cause rarely matters.
Stock removed by containment
SymptomSudden shortfall after a scrap or quality event effectively removes stock from the loop while the card count stays the same.
RecoveryA temporary extra card covering the gap, withdrawn when the quarantined quantity is resolved or replaced.
T has drifted
SymptomGradual increase in near-miss stockouts. Nothing broke; the route frequency changed, or the supplying process started batching.
RecoveryRe-measure replenishment time and resize. Adding a card here treats the symptom and hides the change.
Demand has moved
SymptomPersistent over- or under-supply on a specific part. Demand and replenishment times vary over time, and when changes are frequent the calculated card count becomes outdated quickly.
RecoveryScheduled resize on a defined cadence, plus event-triggered resize on any material change.
Signal not acted on
SymptomCards accumulate at the supplying process. The loop is correctly sized and functionally stopped.
RecoveryCard-age alerting at the collection point. A card older than one replenishment time is a broken loop by definition.
The tell that distinguishes the first four
If shortages are random, suspect a lost card or a containment event. If they are gradually more frequent, suspect T drift or demand movement. Random means a population problem; gradual means an input problem. Treating a gradual pattern as a lost card is how loops end up over-carded and over-stocked while still failing occasionally.
Card and Container Synchronisation
The loop's integrity depends on two populations staying equal. These are the rules that keep them that way, and the reason electronic kanban exists at all.
1One card authorises exactly one containerThe moment a container moves without a card, or a card exists without a container, the loop has stopped controlling anything.
2Both populations are counted, on a cadenceCards in circulation against containers in circulation. The gap is the single most useful loop health figure and almost nobody tracks it.
3Fill cards are visually distinct and time-boxedClearly identified so the temporary card is removed if the lost one is located, and never allowed to become permanent by default.
4Only the process owner issues or withdraws cardsDistributed authority to add a card is how a loop grows by three cards a quarter with no record of why.
5Damaged containers exit the loop formallyWithdraw the matching card at the same moment, or the population gap opens silently.
6Every card issue and withdrawal is loggedCards get lost, are not easily updated, and sit outside MRP and perpetual inventory — which is precisely why many operations move to electronic kanban rather than managing this on paper and a spreadsheet.
When to Resize
Sizing is not an exact science — it is an estimate built on assumptions and approximations that change over time, and what matters is maintaining the system rather than finding a perfect number at the outset. These are the triggers worth encoding. Our analytics and reporting module carries the loop metrics.
Demand shift beyond toleranceSustained movement in D against the value used at last sizing. Set a percentage band and let it fire automatically.
Route frequency changeAny change to milk-run cadence changes T directly, and it is the most common unrecorded cause of loop failure.
Container standard changeC moves and N moves with it. Frequently missed because packaging changes are not treated as logistics changes.
Fill card outstanding too longIf an extra card is needed for an extended period, the inputs to the calculation need reviewing rather than the card being quietly normalised.
Seasonal windowHoliday shipping delays, weather and supplier shutdowns all move lead times temporarily and warrant a planned adjustment.
Scheduled review regardlessOn a fixed cadence even when nothing triggered. Loops that are never reviewed drift toward whichever failure nobody noticed first.
Size Your Loops Against Real Replenishment Times
The deployment brief covers measuring T from its components rather than borrowing it, reconciling card and container populations, card-age and divergence alerting, fill-card governance, and how consumption events wire loop data back to delivery call-off reconciliation upstream.
Replenishment time measurement
Card–container reconciliation
Breakage detection
Resize triggers
Frequently Asked Questions
What is the difference between replenishment time and lead time?
Replenishment time is the round trip — from the card leaving the supermarket until that same card returns with a part in it. Lead time usually describes only the making. The difference is everything the card spends waiting: in the collection point, in transport both ways, in a queue at the supplying process, and in restocking. On a route running twice per shift, waiting for the next pickup can easily exceed the production time. Using lead time in place of T under-sizes the loop, and the error shows up as unexplained shortages.
What safety factor should we start with?
Twenty to thirty per cent for most loops, then adjust from observed performance. Values run from roughly 10% to 50% of lead-time demand depending on demand variability, supplier reliability and item criticality — 10–15% is sufficient where demand is stable and supply reliable, and the upper end is justified for critical or highly variable parts. Where you have usage and lead-time data, the max–min method gives a more defensible number than a percentage: maximum daily usage times maximum lead time, minus average daily usage times average lead time.
Is adding a card ever the right answer?
Temporarily, yes — for a lost card, or where a scrap or quality containment event has effectively removed stock from the loop. In both cases the extra card is a clearly identified temporary fill, managed by the process owner and withdrawn when the situation resolves. What must not happen is normalisation: if the extra card is needed for an extended period, that is a signal to review the inputs to the calculation rather than to accept the higher count. Loops that grow by accretion end up carrying inventory nobody decided to hold.
What happens if we have too many cards?
The loop stops doing its job quietly, which is worse than failing loudly. Too few cards starve the line and you find out immediately; too many hide overproduction and mask the problems the pull system exists to surface. Because sizing cards is effectively choosing your work-in-process limit, and by Little's Law capping WIP caps lead time for a given throughput, an over-carded loop also lengthens flow time. The excess inventory is the visible cost; the invisible one is the problems it conceals.
Should we move to electronic kanban?
For most plant loops, yes, and the reasons are practical rather than ideological. Physical cards get lost, are not easily updated when demand or lead times change, and sit outside MRP and perpetual inventory systems — which typically means an offline program or a spreadsheet running alongside. Electronic kanban removes the loss mode entirely, makes resizing a configuration change rather than a card reprint, and lets card age and population divergence be alerted on automatically instead of noticed during a count.
How often should loops be resized?
On a scheduled cadence and on event triggers, because both matter. Demand and replenishment times vary over time, and when these changes are frequent the calculated card count becomes outdated quickly. Sizing is not an exact science — it is a rough estimate based on assumptions and approximations that shift — so what matters is maintaining the system rather than perfecting the initial number. Encode triggers for demand shift, route frequency change, container standard change and long-outstanding fill cards, then review the rest on a fixed schedule.
How does the loop connect to supplier call-offs?
Through consumption. Where a loop is fed by an external supplier, the pull signal is what should drive the delivery call-off rather than a forecast quantity — and the consumption event at the point of use is what makes the required cumulative reflect what the line actually burned rather than what was booked in at goods receipt. Loops running against forecast-driven call-offs tend to accumulate exactly the inventory the pull system was installed to remove. Our
integrations overview covers the handoffs.
Fix the Input Before You Add the Card
Replenishment time built from its components, safety factors chosen from measured variation rather than habit, card and container populations reconciled on a cadence, and resizing triggered by change rather than by shortage.
Works alongside existing MRP and EWM · Physical or electronic cards · Site-level configuration
August 13, 2026By Alex Rowan
All Blogs