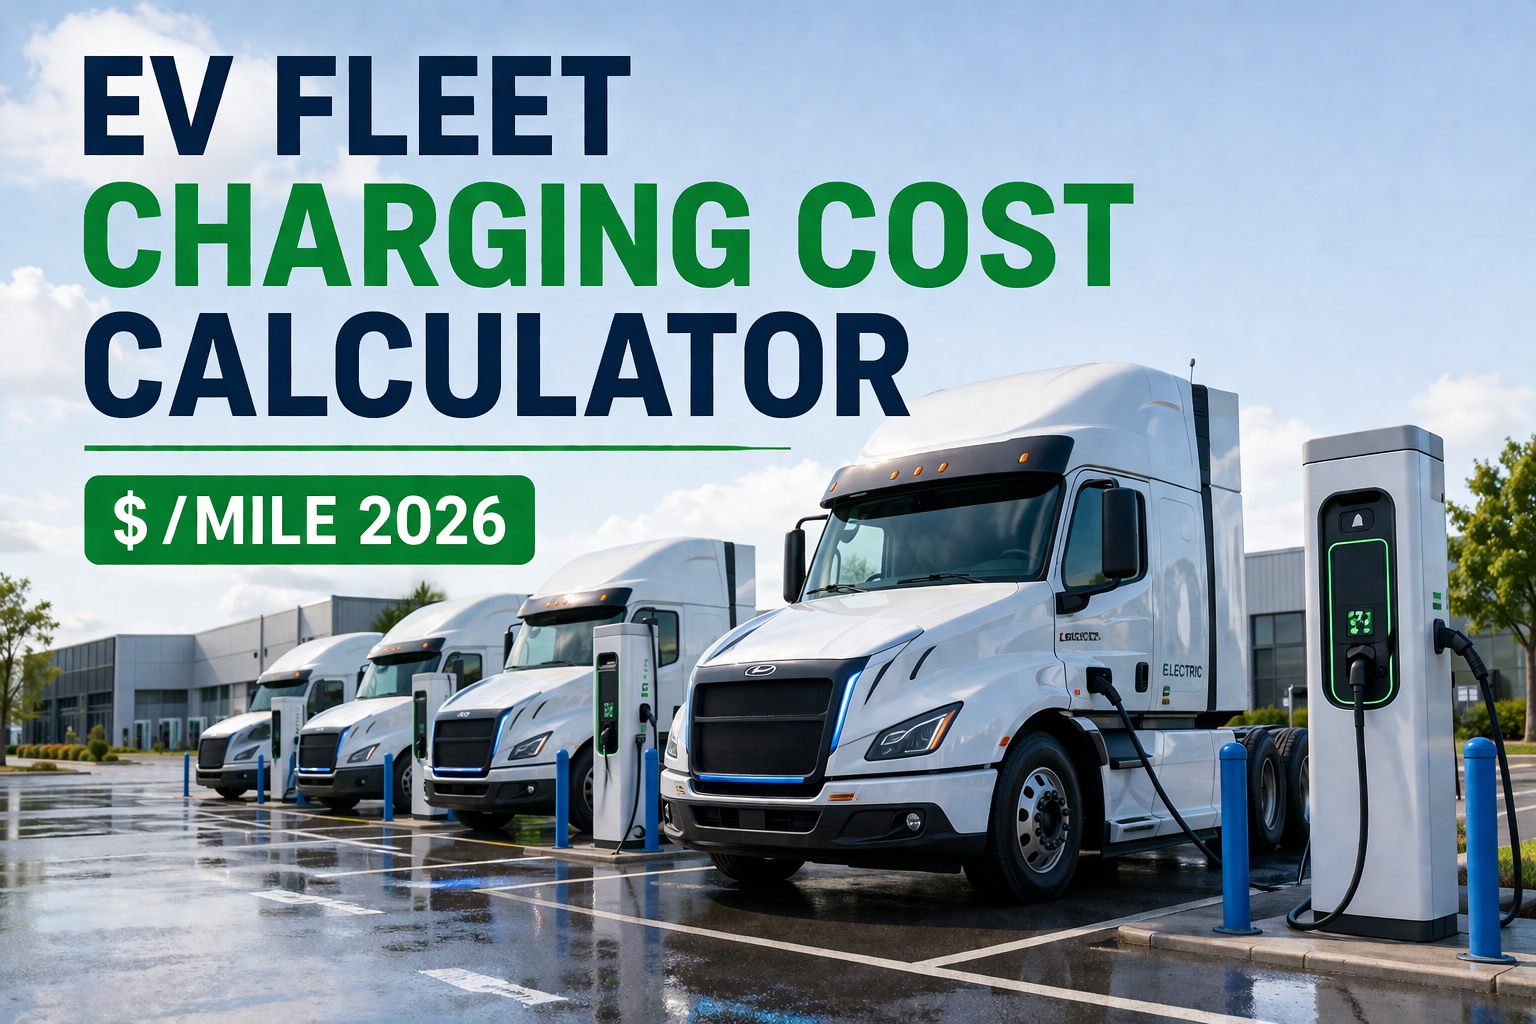
Diesel costs per mile are predictable: $5/gallon ÷ 6 mpg = $0.83/mile. EV cost per mile is anything but. The same Freightliner eCascadia running the same 200-mile route can cost $0.24/mile when charged overnight at $0.12/kWh off-peak, or $0.90/mile if you accidentally hit a public DC fast charger at $0.45/kWh during a peak-demand window. That's a 4× spread driven entirely by when and where you charge not by the truck. Fleets transitioning to electric Class 8 tractors (Freightliner eCascadia, Peterbilt 579EV, Volvo VNR Electric) are discovering that the operational economics of EV freight depend on a single calculation: kWh per mile × $/kWh = $/mile. Get this number wrong and your "cheaper than diesel" pitch to the CFO falls apart in month two when the demand-charge invoice lands. This guide breaks down the actual cost-per-mile math for the three production-volume Class 8 EV tractors in 2026, the electricity rate scenarios that change everything, the hidden demand-charge trap most fleets miss, and how Fleet Rabbit tracks live $/mile per truck so the savings claim survives accounting review.
Stop Guessing Your Cost Per Mile. Calculate It.
Same eCascadia. Same 200-mile route. Same battery. Different charging window — and your cost-per-mile swings from $0.24 to $0.90. The math that decides whether your EV pilot survives the next budget review.
The Formula — Why $/Mile Is the Only Number That Matters
Sticker price gets the headline. Total cost of ownership gets the spreadsheet. But what determines whether an EV truck is profitable on a route is one ratio: cost per mile. Fleet finance teams compare this directly to diesel and accept nothing more abstract. Here's the formula and what each variable actually does.
The kWh-per-mile side is fixed by hardware engineering. The $-per-kWh side is a procurement and scheduling decision under your control. Most of the cost-per-mile spread between successful EV fleets and failing pilots comes from the rate side, not the efficiency side.
2026 Class 8 EV Tractor Efficiency — kWh Per Mile Verified
Three production-volume Class 8 EV tractors in the US in 2026: Freightliner eCascadia, Peterbilt 579EV (next-gen), Volvo VNR Electric. Below is the verified kWh-per-mile for each, computed from manufacturer-published battery and range specs.
Efficiency varies ~30% between models — but rate variation can multiply cost by 4×. The eCascadia at off-peak ($0.23/mi) is cheaper than the most efficient Volvo at DC fast ($0.62/mi). Charging strategy beats truck choice. See How Fleet Rabbit Tracks Per-Truck Efficiency Live →
The 4 Charging Rate Scenarios — Same Truck, Wildly Different Cost
The single biggest variable in EV fleet economics. Most fleets blend 2-3 of these scenarios across a year. Knowing the cost band of each is non-negotiable for accurate budgeting.
Best case. Charging 10pm-6am at depot using utility off-peak rates. Requires Level 2 or low-power DC infrastructure ($15K-$50K per port). Most cost-effective for overnight-park fleets.
Standard case. Charging during business hours at standard commercial tariff. Still 50%+ cheaper than diesel. Default rate for fleets without time-of-use contracts.
On-route case. Charging at public DC fast stations during a route — Electrify America, EVgo, ChargePoint commercial. Useful for emergencies; expensive as a primary strategy.
Worst case. DC fast charging during utility peak-demand window (typically 4-9pm summer). Higher than diesel cost-per-mile. The trap that destroys EV pilot business cases when not avoided.
Track Live Cost Per Mile Per Truck. Not Per Fleet Average.
Fleet averages hide the trucks that hit DC fast chargers during peak demand. Fleet Rabbit logs every charge session with rate, kWh, location, and cost — so the trucks bleeding margin are visible immediately.
The Hidden Cost — Utility Demand Charges
The number nobody warns you about until your second-month invoice. Demand charges are billed by your utility based on your peak power draw (kW), not energy consumed (kWh). One 350 kW DC fast charger session during peak window can add hundreds of dollars to that month's bill — completely separate from the per-kWh rate.
EV vs Diesel — The Cost-Per-Mile Showdown
Diesel benchmark assumes $5.00/gallon and 6 mpg fuel economy. EV best-case at off-peak, worst-case at peak DC fast. Reality for most fleets is the middle-band — and even there, EV beats diesel by ~50%.
Strategic charging puts EVs at 30-50% of diesel cost-per-mile. Sloppy charging puts EVs above diesel. The platform that tracks every session is what separates one outcome from the other. See Live $/Mile Tracking Demo →
How Fleet Rabbit Tracks Live $/Mile Per Truck
Knowing your fleet-average cost-per-mile is meaningless. Knowing that Truck #047 averaged $0.31/mile and Truck #052 averaged $0.71/mile last week — and why — is what protects margins. Fleet Rabbit's EV cost analytics work for diesel, CNG, and electric fleets in one platform.
Every charging event captured with kWh delivered, rate paid ($/kWh), location (depot vs public), peak/off-peak window, demand charge contribution, and the truck/driver involved.
Today, this week, this month — per truck and fleet-wide. Trends visible per route. Anomalies flagged automatically (e.g., truck consistently hitting DC fast vs depot baseline).
Demand charges billed monthly but caused by individual sessions. Fleet Rabbit allocates the demand charge cost back to the trucks that triggered it — making the real cost-per-mile visible.
Set off-peak windows (e.g., 10pm-6am). Fleet Rabbit alerts dispatchers if trucks attempt to charge outside the window — protecting your savings model from human error.
One-click report comparing EV $/mile vs diesel $/mile across the fleet. Materially defensible numbers for CFO/Board reviews — not back-of-envelope estimates.
Federal Section 45W, EPA Clean Heavy-Duty, and California HVIP all require operational reporting. Fleet Rabbit produces the per-vehicle electricity consumption and emissions data the grants demand.
Fleets running Fleet Rabbit on EV deployments report 18-25% lower realized cost-per-mile vs forecast — entirely from catching trucks that drift to expensive charging windows. Schedule an EV Cost Analytics Walkthrough →
Frequently Asked Questions
Manufacturer-rated efficiencies (1.9 to 2.5 kWh/mi for Class 8 EVs) assume optimal conditions. Real-world: add 15-25% for cold weather (battery preconditioning losses), 10-20% for heavy loads near GVWR, 5-10% for hilly terrain. Plan budgets at 2.3-2.8 kWh/mi for conservative forecasting on Class 8 routes.
Pull your utility's commercial rate schedule (typically a "GS-2" or "TOU-D" tariff structure). Identify the per-kWh energy charge AND the demand charge ($/kW). Many fleets focus only on the energy charge and miss the 50% of total cost coming from demand charges. Your utility account manager can walk through it. See How Fleet Rabbit Models Demand Charges →
At consistent rates above $0.42/kWh combined with worst-case 2.0 kWh/mi efficiency = $0.84/mile vs diesel's $0.83/mile. Most fleets cross this break-even line only when relying heavily on public DC fast charging during peak demand windows. Strategic depot charging keeps EVs comfortably below diesel cost.
Yes for the major commercial networks (Electrify America, EVgo, ChargePoint commercial) — typically $0.30-$0.45/kWh with peak-window surcharges that can push to $0.55+/kWh. Some regional networks and TA Travel Centers offer flat $0.32/kWh fleet rates. Always check the specific session price before plugging in.
Depends entirely on charging strategy and route. Off-peak depot fleets typically break even at 80,000-120,000 miles cumulative — well within year-2 of operation. Mixed-charging fleets break even at 150,000-200,000 miles. Public-DC-only fleets may never break even, which is why charging strategy must be locked before vehicle purchase.
Same $3/vehicle/month as diesel — no EV surcharge. Includes per-charge session logging, $/mile dashboards, demand charge allocation, off-peak compliance alerts, and grant documentation reports. Free tier supports up to 3 assets indefinitely. Book a Demo to See Pricing →
Run the Math Once. Track It Live Forever.
kWh-per-mile × $-per-kWh = $-per-mile. Three variables. One output that decides whether your EV pilot defends itself in the boardroom. Fleet Rabbit logs every charge session, allocates demand charges to the trucks that caused them, and produces the CFO-grade $/mile reports that survive accounting review. Used by fleets running eCascadia, 579EV, VNR Electric — and every diesel-EV mix in between.







