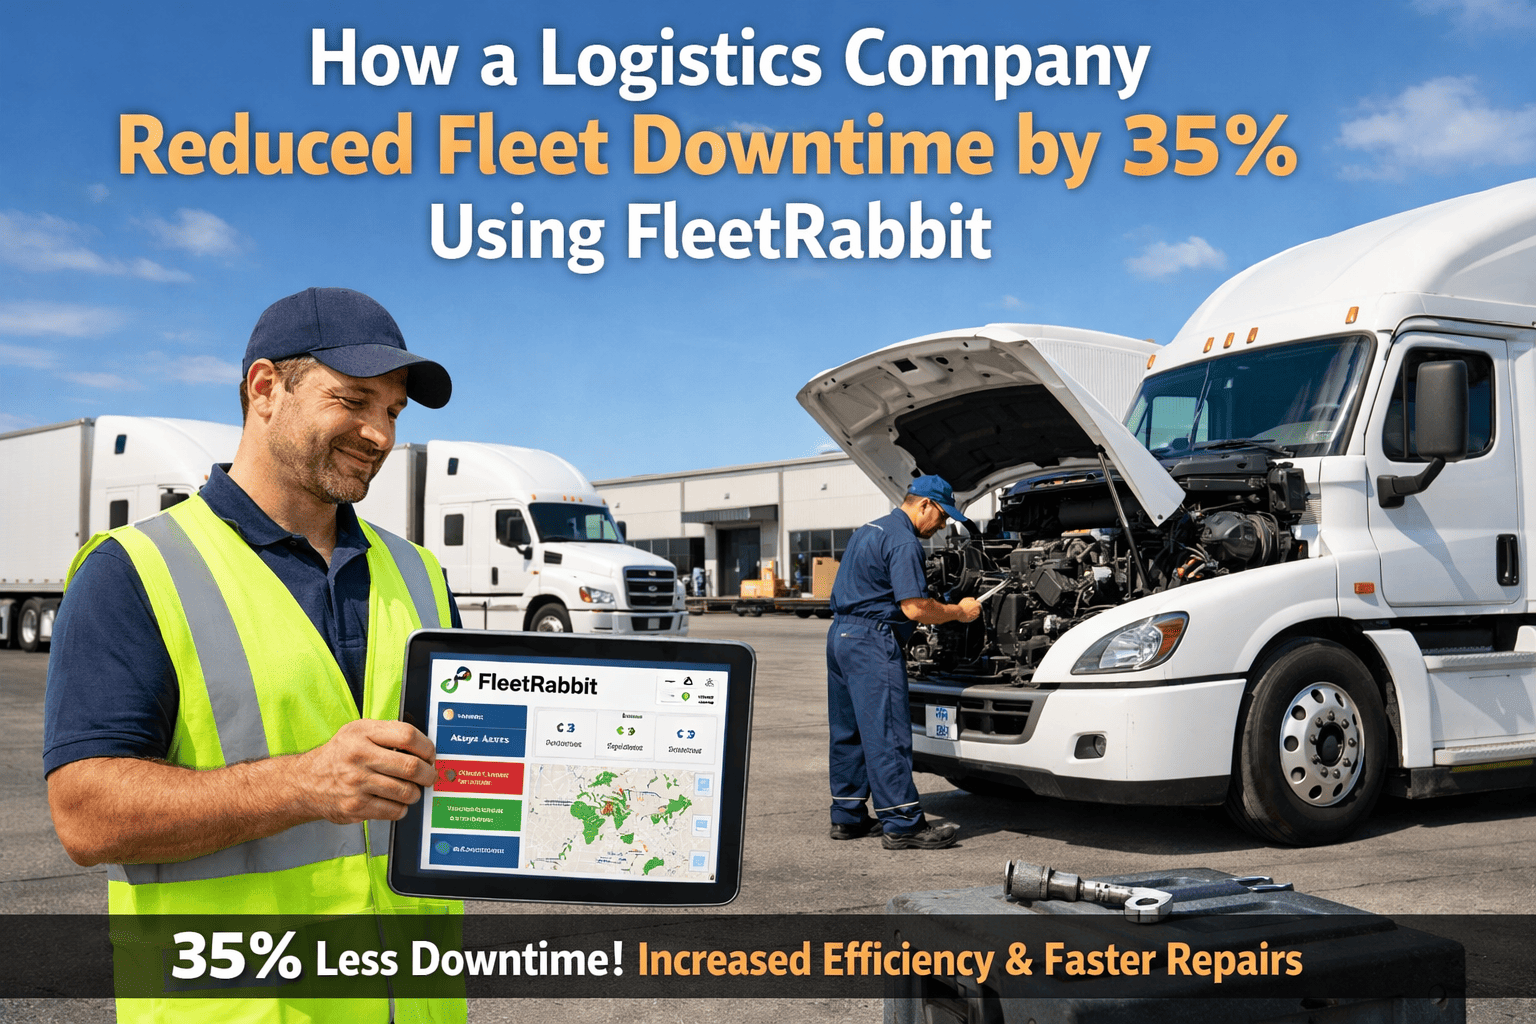
A mid-sized logistics company was losing thousands every month due to unexpected fleet breakdowns, and nobody in the operation could see them coming. Trucks were returning from routes with engine warnings that had been ignored for days. Inspections were being logged on paper and filed in folders nobody opened. Mechanics were spending their mornings reacting to emergency calls instead of working through a scheduled maintenance plan. The result: vehicles sitting in bays, routes being redistributed last-minute, and customers getting the kind of delivery updates no logistics company wants to make.
Within 90 days of implementing FleetRabbit, that same company reduced fleet downtime by 35%, cut maintenance costs by 20%, and cut inspection processing time in half. This is the full story of how they got there. See how this works for your fleet — book a free demo →
The Problem: Breakdowns Nobody Saw Coming
Meridian's fleet operations director, Daniel Reyes, had been managing the company's 87-vehicle fleet for six years. He knew the trucks. He knew the routes. What he didn't know — and what no one in the operation could tell him reliably — was which vehicles were going to fail next week.
Maintenance scheduling ran on a combination of odometer-based reminders in a shared spreadsheet and mechanics flagging issues verbally when they noticed something during a repair. There was no systematic pre-trip inspection process. Drivers completed paper forms that were handed to the depot office at the end of shift — where they sat in a wire tray until a clerk had time to process them. The lag between a driver noting a brake concern on a paper form and a mechanic acting on it averaged four to six days.
The result was a fleet that was technically maintained — oil changes happened, tyres were replaced — but was operating without any real-time visibility into vehicle condition. The breakdown pattern reflected this exactly: of the 14 roadside breakdowns the fleet experienced in the six months before FleetRabbit, 11 involved defects that had been documented by a driver at some point but never actioned. The defect had made it onto a form. The form hadn't made it to anyone who could do anything about it.
The Real Cost: More Than Just Repair Bills
The direct cost of the breakdowns — tow charges, emergency repairs, parts at premium prices — averaged $2,400 per incident. For 14 incidents across six months, that was $33,600 in reactive repair cost. But the direct repair cost was the smaller part of the problem.
Each roadside breakdown meant a driver sitting on the side of the highway for an average of 3.2 hours. It meant a route being redistributed to another driver, often extending their shift and triggering overtime. It meant a customer call explaining a delay, and in two cases over those six months, a penalty clause being invoked by a customer whose SLA was breached. The total cost of the breakdown pattern — repair, driver downtime, redistribution overhead, and customer impact — was estimated by Daniel's team at $6,100 per incident on average. Across 14 incidents: approximately $85,400 in six months from a problem that had been sitting in a wire tray of unprocessed inspection forms.
Is your fleet facing similar breakdown patterns? Book a free 30-minute demo to see how FleetRabbit closes the defect-to-repair gap →
The Solution: Moving From Reactive to Predictive
Daniel wasn't looking for the most sophisticated fleet management platform on the market. He was looking for something that would close the gap between a driver documenting a defect and a mechanic acting on it — and give him a real-time view of his fleet's condition without calling three different people across three depots.
FleetRabbit's approach was built around three changes to how Meridian's fleet operation actually functioned day to day.
Every driver received the FleetRabbit mobile app. Pre-trip and post-trip inspections shifted from paper forms to guided digital checklists completed on the driver's phone in under 90 seconds. When a driver flagged a defect — brake wear, fluid concern, warning light — the app automatically generated a maintenance work order and pushed it to the assigned mechanic's phone within seconds. The 4–6 day defect-to-action lag became under 60 seconds.
FleetRabbit connected to Meridian's existing telematics hardware and began processing mileage, engine hours, fault codes, and driver behavior patterns against each vehicle's maintenance schedule. The system identified vehicles approaching service thresholds before they were overdue — not sending a generic reminder, but alerting when specific vehicle conditions indicated elevated failure risk. Mechanics received prioritized maintenance queues each morning instead of reacting to whoever called in broken first.
For the first time, Daniel had a single dashboard showing the live maintenance status of all 87 vehicles across all three depots. Green vehicles: cleared for dispatch. Amber: service due within 500 miles. Red: active defect or overdue service — not to be dispatched without mechanic sign-off. The morning briefing that had previously run on phone calls and verbal updates shifted to a 10-minute dashboard review. Every vehicle's status was visible, current, and documented.
Implementation: 14 Days From Signup to Full Deployment
One of Daniel's initial concerns was disruption during implementation. The fleet ran six days a week. There was no quiet period when 94 drivers could be trained simultaneously without affecting operations. The phased rollout addressed this directly.
All 87 vehicles imported, telematics integration connected to existing GPS hardware, maintenance schedules configured for each vehicle class. Inspection form templates created for box trucks, vans, and trailers. End-to-end workflow tested: one driver, one inspection, one defect, one work order — verified working before any driver went live.
15 volunteer drivers trained in 45-minute hands-on sessions — app downloaded, first inspection completed on their actual vehicle during training. Paper forms removed from pilot vehicles. Mechanics began processing work orders from the app. Feedback collected at day 7: three minor form configuration adjustments made before full rollout.
Remaining 79 drivers trained across Depots 2 and 3, with Day 1 pilot drivers co-leading sessions. Paper inspection forms physically removed from all vehicles and offices on Day 13. By Day 14, all 87 vehicles were generating daily digital inspection data, all mechanics were working from the FleetRabbit work order queue, and Daniel had his first real-time fleet health dashboard.
Results: What Changed in 90 Days
The results at the 90-day mark were documented by Meridian's operations team and reviewed against the six-month baseline period before FleetRabbit. The numbers were more consistent than Daniel had expected — because the root cause, the paper inspection lag, had been addressed completely rather than partially.
We weren't a poorly-managed fleet. We had mechanics who knew what they were doing and drivers who were flagging problems. We just had a system that was losing the information between the two. FleetRabbit didn't change our mechanics or our drivers — it just stopped losing the data.
Before & After: The Full Operations Comparison
Key Takeaways From This Case Study
Meridian's drivers were already flagging defects. The failure wasn't awareness — it was the system between awareness and action. Paper-based inspection processes with manual processing lags are not a maintenance system. They're a documentation system with no feedback loop. Digital inspection with automated work order generation is the specific architectural change that converts flagged defects into repaired vehicles.
Mileage-based service schedules are a starting point, not a maintenance strategy. A vehicle running heavy routes with frequent stops accumulates wear at a fundamentally different rate than a vehicle doing highway miles. Predictive maintenance that processes actual telematics data — engine hours, fault codes, duty cycle patterns — identifies the vehicles that need attention before their service interval arrives, not after they've already failed.
Meridian's FleetRabbit subscription cost for 87 vehicles was fully recovered within the first 30 days by avoided emergency repair costs alone — before the 35% downtime reduction was fully realized. For any fleet experiencing more than two roadside breakdowns per month, the economics of preventive fleet management software are straightforwardly positive. The question isn't whether the ROI is there — it's how quickly you need to start generating it.
If Your Fleet Is Still Facing Unexpected Breakdowns,
It's Time to Switch to a Smarter System.
Meridian went from 14 roadside breakdowns in six months to 3 in the following quarter — not by hiring more mechanics or replacing vehicles, but by closing the gap between what drivers were reporting and what mechanics were acting on. FleetRabbit does the same for any commercial fleet. Book a free demo and see how much downtime your fleet is carrying that doesn't have to be there.







