Material handling accounts for 15 to 40 percent of total manufacturing operating cost in most production environments — yet the forklift fleet responsible for moving every raw material input and every finished output across the plant floor is almost entirely invisible to the data infrastructure most operations directors rely on for improvement decisions. Kaizen teams map value streams, engineers analyze takt time deviation, and managers review OEE dashboards — while the forklifts, reach trucks, and order pickers connecting every production cell to every storage location idle unmonitored, travel unmeasured, and consume productive capacity unreported. That invisibility is not a minor gap. A single forklift costs over $200,000 per year to operate in a three-shift environment, and most plants are running fleets of 20 to 80 or more. The analytics to close this gap exist — and the plants deploying them are eliminating fleet assets, cutting idle time, reducing accidents by 80 percent, and recovering millions in labor and maintenance cost every year.
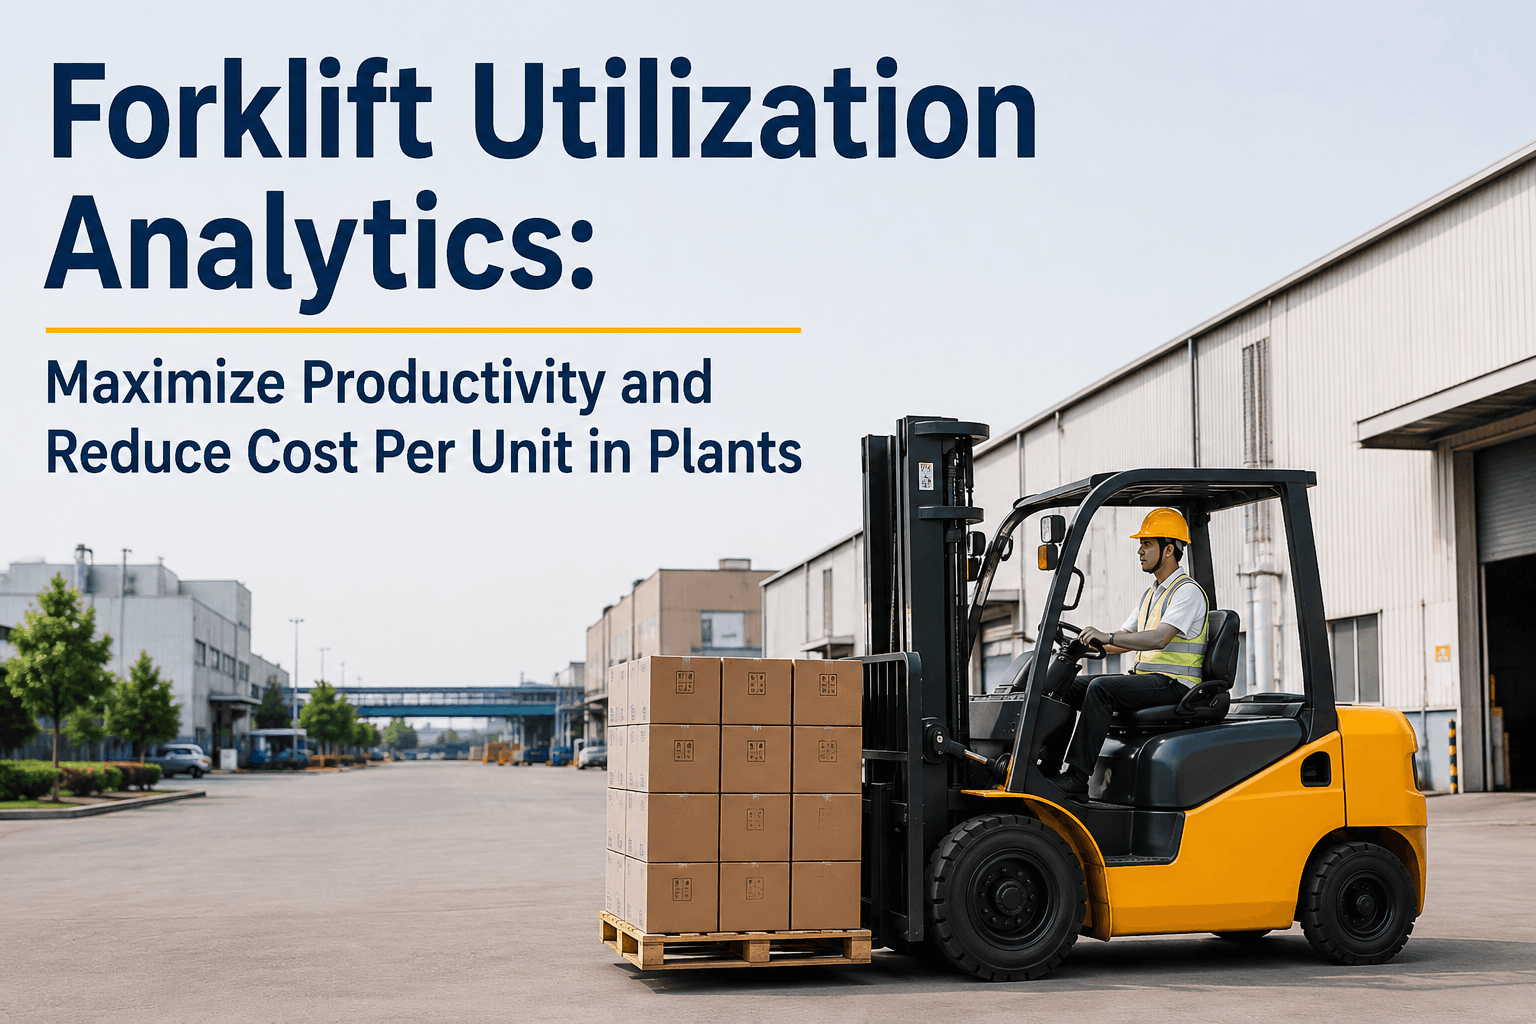
Forklift Utilization Analytics: Maximize Productivity and Reduce Cost Per Unit in Plants
The Utilization Blind Spot in Most Manufacturing Plants
Ask any plant manager how many forklifts are on their floor and they can answer immediately. Ask them what percentage of those forklifts are actually in productive motion at any given moment and the answer becomes a rough estimate at best. The North American average forklift utilization rate dropped to 46.9% as of January 2025 — meaning the average plant floor forklift is idle or unproductive for more than half its available operating time. For a plant running 30 forklifts at $200,000 per unit per year in fully-loaded operating cost, that represents approximately $3 million per year in productive capacity that exists on paper but is never captured in output.
The problem is structural: forklifts move between production cells, staging areas, and storage locations across large floor plans, making their activity patterns invisible to the fixed-position monitoring systems that track machine utilization in the production cells themselves. Without telematics sensors on each vehicle transmitting real-time location, motion state, and operational activity to a central analytics platform, fleet managers are making right-sizing, scheduling, and deployment decisions without the data those decisions require. Sign up with FleetRabbit to make your plant's forklift utilization visible in real time across every vehicle and every shift.
Three Ways Forklift Analytics Deliver Measurable Cost Reduction
Forklift analytics deliver financial return through three distinct cost categories — fleet right-sizing, labor productivity, and maintenance efficiency. A major automotive manufacturer documented all three simultaneously: by deploying utilization analytics, the company eliminated 7 percent of its forklift fleet, saving approximately $500,000 per year in equipment costs, and cut labor costs by over $2 million per year by identifying operator and scheduling inefficiencies that analytics exposed through heat maps comparing productivity and utilization across plants. The total annualized benefit exceeded $2.5 million — from a single analytics deployment across one enterprise.
Utilization data identifies which vehicles in your fleet are consistently underused across shifts and zones. When analytics show that 5 forklifts average below 30% utilization across three shifts while adjacent vehicles operate at 85% or more, the right-sizing opportunity becomes quantified rather than speculative. Right-sizing eliminates lease payments, maintenance costs, operator assignments, battery charging infrastructure load, and depreciation exposure on assets that are not earning their keep.
Operator utilization data measures productive travel time, lift activity, idle time, and deadman (unattended engine-on) events per operator per shift. Analytics drill down from enterprise view to individual operator, identifying top performers whose methods can be standardized and operators whose patterns indicate training needs, unsafe behaviors, or workflow inefficiencies that are generating avoidable idle time at the shift level.
PM scheduling based on actual motion hours — not calendar time or key-on hours — ensures forklifts are serviced at the right interval for their actual work intensity. Scheduling PM every 250 motion hours rather than every 300 hours may sound more conservative but produces fewer mid-shift breakdowns and lower total maintenance spend when analytics establish that a specific vehicle's duty cycle warrants the tighter interval.
FleetRabbit's forklift utilization analytics platform gives plant managers real-time visibility into every vehicle's productive time, idle patterns, operator performance, and maintenance status — across every shift and every zone.
The Analytics Layer: What Real-Time Data Actually Measures
Telematics sensors installed on every forklift, reach truck, and order picker transmit operating status, location, and activity data every two seconds to the plant floor dashboard — updated live and visible across all vehicles simultaneously. Each vehicle's operational state is classified in real time: productive travel, load and unload activity, idle engine-on, and powered-down. Utilization rates are calculated continuously per vehicle, per operator, per shift, and per plant zone — giving operations managers the precise productive capacity picture that improvement decisions require.
The data capture is layered across four levels that each answer a different operational question. Vehicle-level data answers which assets are working and which are idle at any moment. Zone-level data answers where the floor has material flow bottlenecks and idle hotspots. Operator-level data answers whose technique and behavior patterns are contributing to or eroding productivity. And plant-level data aggregates into the benchmarking view that allows multi-site operations to identify best practices at high-performing facilities and apply them to lagging ones. Book a FleetRabbit demo to see how all four data levels surface in a single plant floor dashboard for your specific facility layout.
Reducing Cost Per Unit: The Manufacturing Finance Perspective
Cost per unit — the total cost allocated to producing one unit of output — is the metric manufacturing finance teams use to evaluate operational efficiency. Forklift fleet costs enter the cost-per-unit calculation through three lines: direct labor (forklift operator wages), indirect labor (maintenance technician time), and equipment cost (depreciation, lease payments, repairs). When utilization analytics reveal that your fleet is running at 46.9% average utilization — the North American benchmark — the implication for cost-per-unit is that you are allocating full fleet cost to your output while capturing less than half the productive potential you are paying for.
The improvement path is direct. Eliminating chronically underutilized vehicles removes their lease, maintenance, and depreciation cost from the numerator without changing the output denominator. Shifting operator assignments to match utilization data — deploying more operators during high-demand periods and redeploying during low-demand periods — reduces idle labor cost per shift. Implementing motion-hour-based PM reduces maintenance labor hours and emergency repair frequency. Each of these changes reduces the forklift cost allocated per unit produced without requiring capital investment in new equipment or process redesign. Sign up with FleetRabbit and start measuring the forklift cost that is flowing into your cost-per-unit calculation today.
Safety Analytics: The Hidden ROI Most Plants Underestimate
Forklift accidents are one of the most significant and underestimated cost line items in manufacturing plant operations. OSHA estimates 85 forklift fatalities and 34,900 serious injuries in U.S. workplaces each year, with forklifts involved in approximately 11 percent of all forklift accidents resulting in a fatality at the facility. Beyond the human cost, the financial impact of a single forklift accident includes workers' compensation, insurance premium increases, OSHA investigation costs, potential citations, rack and equipment repair, production line disruption, and the organizational time consumed by incident investigation and reporting.
One automotive manufacturer deployed forklift analytics specifically targeting safety metrics — monitoring speed violations, impact events, unauthorized zone access, and operator behavior patterns across their enterprise. The result was an 80 percent reduction in accidents and damage costs. The analytics platform surfaced which operators were generating the most impact events, which zones had the highest incident concentration, and which shift patterns correlated with elevated risk — providing management with actionable, data-driven insight rather than anecdotal reports. Book a FleetRabbit demo to see how safety analytics integrate with utilization monitoring in the same platform dashboard.
FleetRabbit connects to your forklift fleet via telematics sensors and delivers real-time utilization dashboards, operator performance analytics, motion-hour PM scheduling, and safety KPI tracking — all in one platform built for manufacturing.







