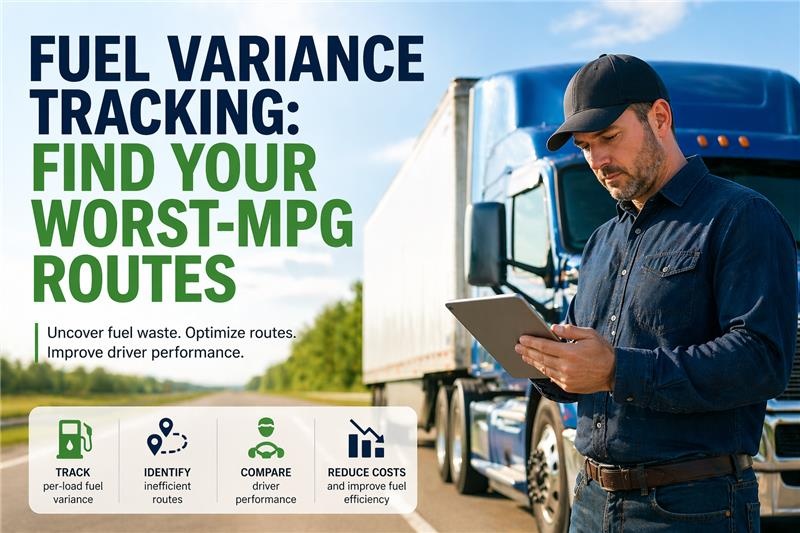
Your fleet's fuel costs are not uniform. Some drivers consistently hit 7.5 MPG while others struggle at 5.8 MPG on identical routes with identical trucks. Some lanes burn 15% more fuel than expected while others come in under budget. The difference between your best and worst performers could be costing you $50,000+ annually but without per-load variance tracking, you cannot see it. FleetRabbit breaks down fuel consumption by driver, route, and load so you can identify exactly where the waste is happening and fix it.
Fuel Variance Tracking: Find Your Worst-MPG Drivers & Routes
Track per-load fuel variance to uncover wasteful routes and inefficient drivers. Compare actual consumption against benchmarks. Get actionable reports that pinpoint exactly where your fuel budget is leaking.
The Hidden Cost of MPG Variance
Most fleet managers know their average fuel economy. But averages hide the real story. When your best driver achieves 7.5 MPG and your worst gets 5.5 MPG on the same equipment, that 2.0 MPG gap translates directly to thousands in preventable waste per driver per year.
With 10 underperforming drivers, that gap becomes $200,000+ annually. With 25, over half a million dollars. Fuel variance tracking identifies exactly who is underperforming, on which routes, and by how much — so you can coach, retrain, or reassign before the losses compound.
What Causes Fuel Variance?
Fuel efficiency differences between drivers and routes stem from multiple factors. Understanding these causes helps you target interventions effectively rather than applying generic "drive better" coaching that rarely sticks.
Keep vehicles running at peak efficiency with scheduled maintenance.FleetRabbit PM Scheduling ensures tire pressure checks, filter replacements, and oil changes happen on time — protecting your fuel economy.
How FleetRabbit Tracks Fuel Variance
FleetRabbit calculates fuel variance at three levels: per driver, per route, and per load. Each transaction is compared against established benchmarks to flag anomalies and identify patterns that indicate addressable waste.
FleetRabbit calculates expected fuel consumption for each route based on distance, terrain profile, typical payload, and historical performance. Benchmarks adjust automatically as you accumulate more data. New routes use industry averages until sufficient trips establish a baseline.
Fuel transactions import automatically from fuel cards (Comdata, FLEETCOR, EFS) or telematics-based fuel sensors. Each fill-up is tagged with driver, vehicle, route, and timestamp. Missing data is flagged for manual entry.
For each completed load, FleetRabbit compares actual gallons consumed against expected consumption. Variance is expressed as percentage (+12% = used 12% more fuel than expected) and absolute gallons. Results aggregate by driver, route, vehicle, and time period.
Single bad trips happen. FleetRabbit looks for persistent patterns: drivers consistently 15%+ over benchmark, routes that always underperform, vehicles that decline over time. These patterns reveal systemic issues worth addressing.
Weekly and monthly variance reports rank drivers and routes by fuel efficiency. Drill down to individual loads to understand why specific trips deviated. Export data for driver coaching sessions or management review.
Track fuel spending alongside parts and labor for complete cost visibility.FleetRabbit Cost Tracking combines fuel variance data with maintenance expenses in a single dashboard.
See Your Fleet's Fuel Variance in 5 Minutes
Import your fuel data. FleetRabbit instantly calculates variance by driver, route, and vehicle. Find your worst performers today.
Driver Leaderboard: Rank by Fuel Efficiency
FleetRabbit's driver leaderboard ranks all drivers by fuel efficiency relative to fleet benchmarks. You see at a glance who your top performers are, who needs coaching, and the dollar impact of each driver's performance.
| Rank | Driver | Avg MPG | vs Fleet Avg | Loads (30d) | Est. Annual Impact |
|---|---|---|---|---|---|
| 1 | M. Johnson | 7.8 | +21.9% | 24 | +$8,420 saved |
| 2 | T. Williams | 7.4 | +15.6% | 22 | +$6,180 saved |
| 3 | K. Martinez | 7.1 | +10.9% | 26 | +$4,320 saved |
| 4-8 | 5 drivers within ±5% of fleet average (6.1 - 6.7 MPG) | ||||
| 9 | J. Thompson | 5.8 | -9.4% | 21 | -$4,860 cost |
| 10 | R. Davis | 5.2 | -18.8% | 19 | -$9,720 cost |
Sample data. Est. Annual Impact based on 120,000 miles/driver at $3.67/gal diesel.
Route Variance Analysis
Some routes consistently consume more fuel than benchmarks suggest. This can indicate routing inefficiencies, unexpected terrain, traffic patterns, or shipper/receiver delays that force excessive idling. Route variance analysis helps you identify lanes that need optimization.
Automate inspections to catch vehicle issues before they tank fuel economy.FleetRabbit Digital DVIR ensures pre-trip checks catch low tires, air filter issues, and other efficiency killers.
Variance Alert System
FleetRabbit generates automatic alerts when fuel variance exceeds your configured thresholds. You choose what triggers alerts and who receives them.
Triggers when any individual load exceeds variance threshold. Default: +25% over expected consumption.
Triggers when a driver's rolling 7-day average exceeds threshold. Catches persistent underperformers, not one-off bad trips.
Triggers when a specific vehicle's efficiency drops compared to its historical baseline. Often indicates maintenance issue.
Triggers when a route's variance changes significantly from its historical pattern. May indicate new traffic, construction, or routing issue.
From Data to Action: Coaching Workflow
Identifying underperformers is only valuable if you can improve them. FleetRabbit's variance data powers a structured coaching workflow that turns insights into results.
Weekly variance report flags bottom 3 drivers by fuel efficiency. System provides specific loads and routes where variance was worst.
Review telematics for hard braking, excessive speed, idle time. Check if variance correlates with specific vehicle or route. Rule out equipment issues.
One-on-one session with driver using their specific data. Show variance vs peers. Set improvement target (e.g., reduce variance from +18% to +8% in 30 days).
Track driver's variance weekly. Recognize improvement. Escalate if no progress after 60 days. Document everything for HR if needed.
A 45-truck LTL fleet implemented variance-based coaching after discovering their bottom 5 drivers were averaging 22% worse fuel economy than their top 5. After 90 days of targeted coaching:
Results: Bottom 5 drivers improved average variance from +22% to +9%. Fleet-wide fuel costs dropped 6.2%, saving approximately $127,000 annually. Two drivers who showed no improvement were reassigned to local routes with less highway driving.
Frequently Asked Questions
Expected consumption is based on route distance, terrain profile (elevation changes along the route), typical payload weight, and historical performance data from your fleet on that lane. New routes use industry benchmarks (approximately 6.5 MPG for Class 8 trucks) until you accumulate enough data to establish a custom baseline.
At minimum, you need fuel transaction data (from fuel cards or manual entry) and trip records (origin, destination, driver, vehicle). For richer analysis, integrate telematics data (GPS, speed, idle time) and load weight information. FleetRabbit works with partial data but provides better insights with more complete records.
Yes. Fuel theft often appears as sudden spikes in consumption on specific vehicles or drivers. A truck that normally gets 6.5 MPG suddenly showing 4.8 MPG warrants investigation. FleetRabbit flags these anomalies automatically. Combine with fuel level sensors for real-time theft detection.
Most fleets identify $3,000-10,000 in addressable waste within the first month of tracking. Actual savings depend on coaching effectiveness and driver willingness to change behavior. Typical payback period is 30-90 days. Even identifying one chronically underperforming driver pays for the system annually.
Yes. FleetRabbit calculates separate benchmarks for each vehicle class. A Class 6 medium-duty truck isn't compared against Class 8 tractors. You can also set custom vehicle groups for more granular comparison (e.g., sleeper vs day cab, 2020+ models vs older units).
Basic variance tracking is available in all FleetRabbit plans, including the free tier for up to 3 vehicles. Advanced features like automated alerts, custom benchmarks, and driver coaching workflows are available in paid plans. Book a demo to see the full feature set.
Stop Guessing. Start Tracking.
Import your fuel data and see exactly which drivers, routes, and vehicles are costing you money. FleetRabbit calculates variance automatically — you focus on fixing the problems.







