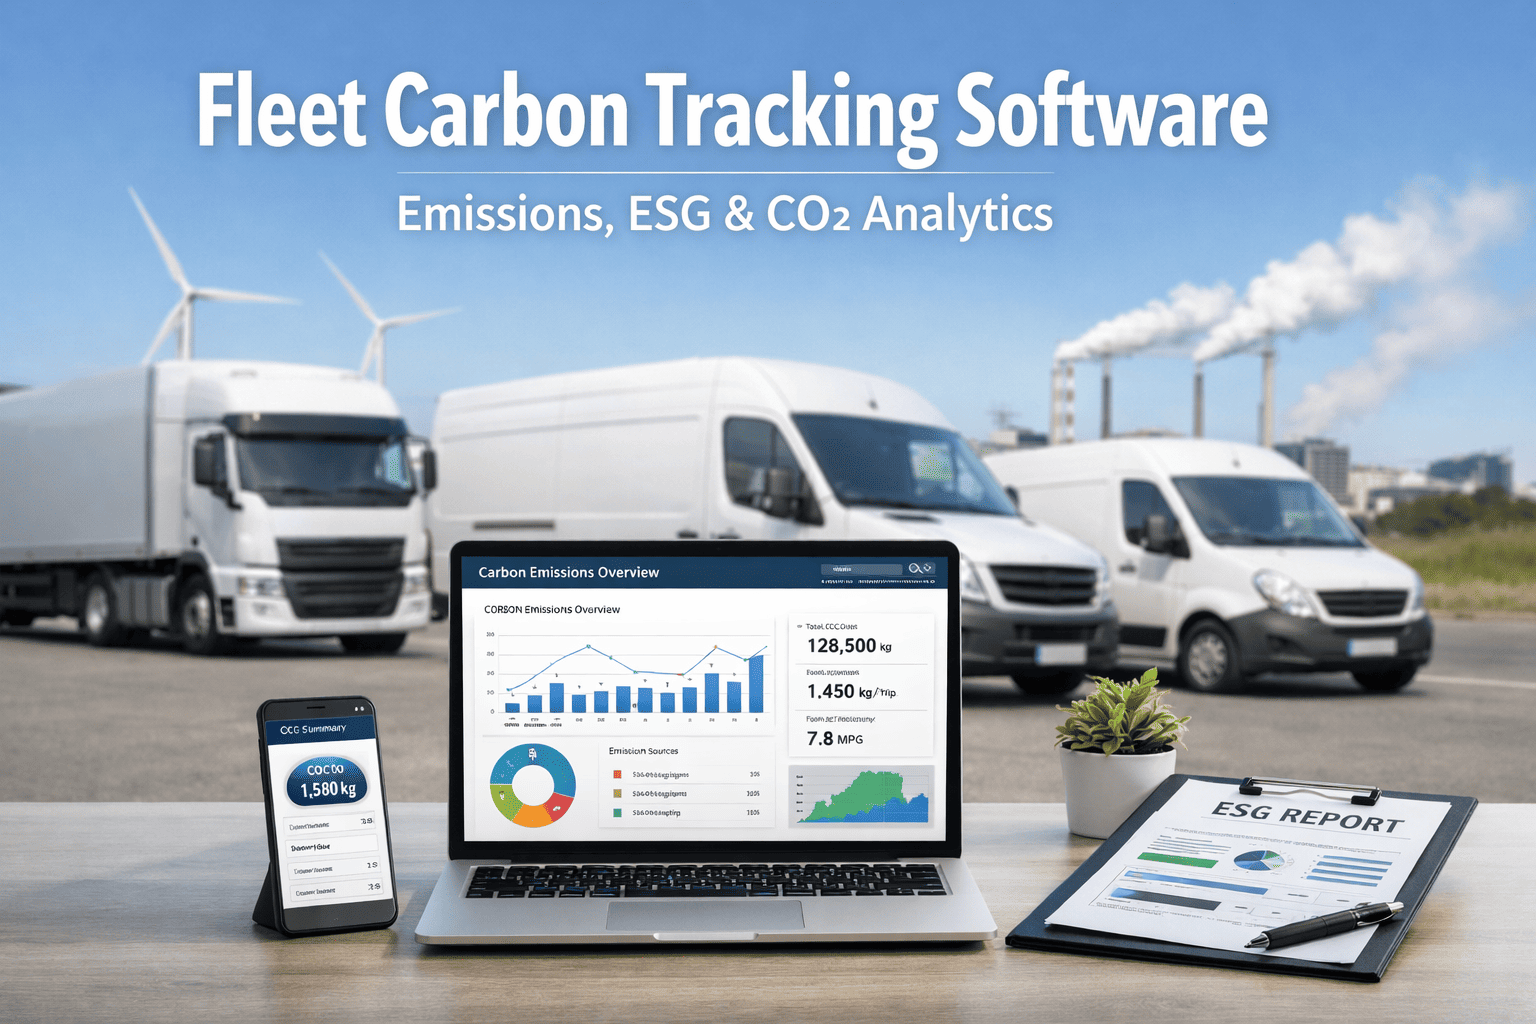
Track fleet emissions, CO2 per mile, fuel consumption, and ESG metrics with advanced fleet carbon tracking software. Generate audit-ready sustainability reports, monitor EV vs ICE performance and reduce environmental impact for enterprises meeting ESG goals and regulatory compliance.
Fleet Carbon Tracking Software
Fleet carbon tracking is no longer optional — it's a business requirement. Over 60% of freight spending now comes from shippers demanding emissions data. California's Climate Corporate Data Accountability Act and EU's CSRD mandate Scope 1, 2, and 3 reporting with penalties up to $500,000 for non-compliance.
Why Fleet Carbon Tracking Matters in 2026
Fleet operations typically account for 15-30% of corporate carbon emissions, making vehicles the largest controllable emission source for logistics companies. The average commercial vehicle produces 400g CO₂ per mile — diesel trucks emit 10.21 kg CO₂e per gallon, gasoline vehicles 8.89 kg. Companies without carbon tracking now face contract exclusions, higher insurance costs, and regulatory penalties.
Fortune 500 shippers (Walmart, Amazon, Target) now require SmartWay certification and emissions data. No data = no contracts.
Insurance carriers now factor emissions performance into premiums. ESG-linked lending offers lower rates only for sustainable operations.
California and EU regulations now mandate emissions reporting with fines up to $500,000/year for non-compliance starting 2026.
A regional carrier implemented carbon tracking in Q1 2025. Within 6 months:
Key Regulations Requiring Fleet Emissions Reporting
Multiple overlapping regulations now govern fleet emissions reporting. Understanding which apply to your operations ensures compliance and helps you avoid duplicative reporting. Schedule a compliance consultation to understand your requirements.
Understanding Scope 1, 2, and 3 Emissions
The GHG Protocol defines three emission scopes. For fleets, understanding these categories is essential for accurate reporting and identifying reduction opportunities.
Fuel combustion in company-owned vehicles — diesel, gasoline, CNG. This is the primary focus for most fleet carbon tracking programs.
Fuel (gallons) × Emission Factor = CO₂e
Diesel: 10.21 kg/gallon | Gasoline: 8.89 kg/gallon
Purchased electricity for EV charging and facilities. Becomes dominant as fleets electrify. Varies significantly by regional grid carbon intensity.
kWh consumed × Grid Emission Factor = CO₂e
Factor varies by state/region grid mix
Third-party carriers, fuel production, vehicle manufacturing. Critical because YOUR Scope 1 = Your CUSTOMER'S Scope 3. This is what Fortune 500 customers request.
Connect your fuel cards and telematics to FleetRabbit and see your carbon footprint instantly with audit-ready ESG reports.
How to Calculate Fleet Carbon Emissions
Three primary methodologies power fleet carbon tracking. Fuel-based calculation is the gold standard preferred by auditors. Get help setting up your emissions tracking.
Multiplies actual gallons consumed by EPA emission factors. Captures real-world efficiency including driver behavior, route conditions, idle time, and maintenance status.
Uses mileage data combined with vehicle-class emission factors. Useful when fuel data unavailable, but less precise than fuel-based methods.
Estimates emissions from fuel expenditure and average prices. Useful for initial assessments when detailed data unavailable.
Most fleets will operate hybrid ICE/EV portfolios through 2030. Track both in a unified platform.
Fleet Decarbonization Strategies
Measuring emissions is step one. The real value comes from identifying reduction opportunities across fuel efficiency, alternative fuels, and operational optimization. Develop your decarbonization roadmap with our experts.
U.S. trucks burn 3 billion gallons of fuel annually just idling. A 40-truck fleet idling 2 hours/day wastes ~29,000 gallons per year — roughly $100,000 at 2025 fuel prices. Every 10% of idle time = 1% decline in overall fuel economy. Anti-idling laws in CA, NY, and other states carry fines of $300-$1,000+ per violation.
"Fleet operators who wait for perfect electric vehicle solutions miss the reality that 70% of achievable emissions reductions come from operational improvements and existing technology available today."
Frequently Asked Questions
What regulations require fleet emissions reporting in 2026?
California's Climate Corporate Data Accountability Act (companies over $1B revenue), EU CSRD (companies with EU operations over €150M), and de facto requirements from EPA SmartWay participation. While SmartWay is "voluntary," most Fortune 500 shippers require it for contract eligibility. Check your compliance requirements.
How do I calculate my fleet's carbon footprint?
The most accurate method is fuel-based calculation: multiply fuel consumed by EPA emission factors (Diesel: 10.21 kg CO₂/gallon, Gasoline: 8.89 kg/gallon). FleetRabbit automates this by integrating with fuel cards and telematics. Start your free trial to see your carbon footprint in minutes.
What's the difference between Scope 1, 2, and 3 emissions?
Scope 1: Direct emissions from fuel combustion in your vehicles (60-80% of fleet footprint). Scope 2: Indirect emissions from purchased electricity (EV charging). Scope 3: Value chain emissions (your Scope 1 becomes your customer's Scope 3). Fortune 500 companies need your Scope 1 data for their Scope 3 reporting.
How much can I reduce emissions with carbon tracking?
Companies using fleet carbon tracking software report 15-30% emission decreases within the first year, plus 40% fuel cost reductions. Quick wins like idle reduction and route optimization deliver 15-25% reduction with minimal capital investment. Get your reduction roadmap.
Do electric vehicles eliminate fleet emissions?
EVs eliminate Scope 1 (tailpipe) emissions but create Scope 2 emissions from charging electricity. The net impact depends on your regional grid's carbon intensity. In clean-grid states, EVs dramatically reduce total emissions. In coal-heavy regions, the benefit is smaller. Most fleets will operate hybrid ICE/EV portfolios through 2030.
Connect your fuel cards and telematics to FleetRabbit and get an instant emissions baseline with audit-ready ESG reports. Join 3,200+ fleet operators navigating climate disclosure requirements.







